Cornhusker Economics June 24, 2015
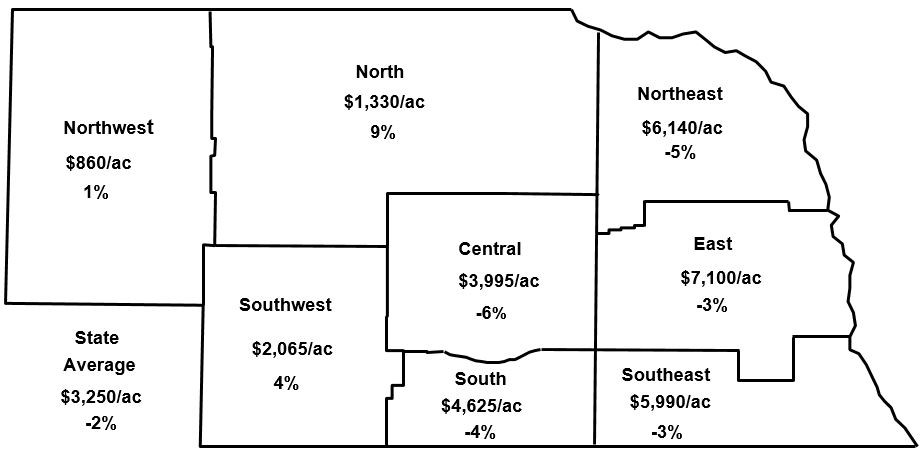
Nebraska agricultural land values declined two percent according to the recently published Nebraska Farm Real Estate Market Highlights. As of February 1, 2015, the weighted average farmland value for the state dropped over the prior 12-month period to $3,250 per acre (Figure 1 and Table 1). Cash rental rates for land in 2015 followed trends comparable to 2014 as irrigated and dryland cropland rental rates declined while pasture and cow-calf pair rental rates rose across Nebraska (Table 2).
| Type of Land | Northwest | North | Northeast | Central | East | Southwest | South | Southeast | State |
|---|---|---|---|---|---|---|---|---|---|
| Dryland Cropland (No Irrigation Potential) | |||||||||
|
$/acre |
730 -14 |
1,580 -8 |
5,645 -12 |
3,115 -11 |
5,980 -9 |
1,966 -6 |
3,340 -4 |
5,060 -7 |
3,390 -9 |
| Dryland Cropland (Irrigation Potential) | |||||||||
|
$/acre |
870 -7 |
2,290 -4 |
7,065 -2 |
4,095 -17 |
7,310 -3 |
1,950 -4 |
4,510 -11 |
6,940 -2 |
5,030 -4 |
| Grazing Land (Tillable) | |||||||||
|
$/acre |
535 |
1,395 21 |
3,695 -9 |
2,615 14 |
4,205 16 |
1,135 28 |
2,350 -3 |
3,035 -8 |
1,515 9 |
| Grazing Land (Nontillable) | |||||||||
|
$/acre |
490 21 |
745 |
2,580 4 |
2,030 22 |
3,010 20 |
945 17 |
1,815 2 |
2,275 5 |
1,005 16 |
| Hayland | |||||||||
|
$/acre |
1,115 9 |
1,905 15 |
3,630 25 |
2,890 23 |
4,080 24 |
1,965 27 |
2,955 26 |
3,100 23 |
2,355 20 |
| Gravity Irrigated Cropland | |||||||||
|
$/acre |
3,235 6 |
4,135 -2 |
7,355 1 |
6,905 -14 |
8,445 -3 |
4,435 -2 |
7,095 -3 |
7,995 -4 |
6,900 -6 |
| Center Pivot Irrigated Croplanda | |||||||||
| $/acre % change |
3,625 |
4,835 -3 |
8,150 -8 |
7,825 -12 |
9,575 -3 |
5,790 1 |
8,270 -2 |
9,425 -3 |
7,315 -5 |
| All Land Averageb | |||||||||
|
$/acre |
860 1 |
1,330 9 |
6,140 -5 |
3,955 -6 |
7,100 -3 |
2,065 4 |
4,625 -4 |
5,900 -3 |
3,250 -2 |
bWeighted averages.
| Type of Land | Northwest | North | Northeast | Central | East | Southwest | South | Southeast |
|---|---|---|---|---|---|---|---|---|
| Dryland Cropland | ||||||||
|
Average |
35 -13 50 25 |
65 -7 85 40 |
235 -4 305 175 |
105 -5 140 85 |
205 -5 255 155 |
45 -10 60 30 |
85 -6 115 65 |
170 -3 215 130 |
| Gravity Irrigated Cropland | ||||||||
|
Average |
135 -7 180 75 |
195 -5 230 155 |
285 -2 335 225 |
235 -6 270 195 |
300 -5 355 260 |
185 -3 225 145 |
220 -2 270 175 |
255 -14 310 225 |
| Center Pivot Irrigated Croplanda | ||||||||
| Average % change High Third Quality Low Third Quality |
175 |
235 -6 275 190 |
365 -1 430 285 |
245 -6 295 215 |
330 -7 385 270 |
250 -18 310 225 |
255 -6 330 240 |
300 -10 360 265 |
| Pasture | ||||||||
|
Average |
13.50 35 20 10 |
30 20 40 20 |
90 29 120 60 |
40 33 50 35 |
65 18 75 50 |
25 25 35 20 |
40 14 45 35 |
55 10 65 35 |
| Cow-Calf Pair Rates (Dollars Per Month)b | ||||||||
| Average % change High Third Qualityc Low Third Qualityc |
40.90 53.60 35.00 |
65.55 83.35 53.90 |
62.05 81.00 45.50 |
64.10 78.15 56.75 |
64.55 79.80 50.95 |
60.70 75.00 52.15 |
57.50 66.50 48.25 |
58.90 68.25 46.25 |
a Cash rents on center pivot land assumes landowners own total irrigation system.
b A cow-calf pair is typically considered to be 1.25 to 1.30 animal units (animal unit being 1,000 lb. animal). However, this can vary depending on weight of cow and age of calf.
c Cow-calf pair rates will vary by services provided by the landowner.
Survey panel members indicated current crop prices and farm input costs as the most negative factors leading to a reduction in cash rental rates for cropland. Current livestock prices were noted as the most positive factor leading to higher pasture and cow-calf pair rental rates in Nebraska. Property tax levels and future property tax policies were also listed as negative factors impacting area land values in Nebraska for 2015.
Since February 1, 2014, the largest percent increase in land value for Nebraska reported by survey participants occurred in hayland and nontillable grazing land at 20 and 16 percent respectively. Like 2014, part of the reason for these increases relates to cattle prices remaining near record levels in 2015. The increase in price for these two land classes varied across Nebraska.
The Southwest district reported the highest rate of increase for hayland at 27 percent with the other regions reporting increases ranging between 9 and 26 percent. Rates of increase for nontillable grazing land ranged between 2 and 22 percent with the lower increase in values focusing in the Northeast, East, and Southeast.
Decreases in the value of dryland and irrigated cropland followed comparable trends. On average, irrigated cropland values declined at a slower rate than dryland cropland without irrigation potential. Gravity irrigated and center pivot irrigated cropland rates dropped 6 and 5 percent respectively throughout most of Nebraska, but a small increase of 6 percent was reported for the Northwest District. The decline in value for dryland cropland without irrigation potential ranged between 14 percent in the Northwest and 4 percent in the South District.
Cash rental rate trends across Nebraska were comparable to the changes in land values for the various classes of land. Pasture and cow-calf pair rental rates set new records across the state as industry participants demonstrated their willingness to bid up the value to use these resources. Tightening profit margins for grain producers resulted in rate declines for dryland and irrigated cropland across all of the districts.
Survey results shown and discussed in this report are findings from the University of Nebraska - Lincoln 2014 Nebraska Farm Real Estate Market Survey. Land values and rental rates presented in this report are averages of survey panel members' responses by district. Actual land values and rental rates may vary depending upon the quality of the parcel and local market for an area. Complete results from the survey are available electronically via the Nebraska Farm Real Estate website: agecon.unl.edu/realestate
Land appraisers, farm managers, or agricultural finance professionals from Nebraska interested in participating in future Nebraska Farm Real Estate Market Surveys are invited to contact the Department of Agricultural Economics at the University of Nebraska-Lincoln. Interested parties can contact the Department of Agricultural Economics by phone: 402-472-1913 or email agecon@unl.edu
Jim Jansen, 402-254-6821Nebraska Extension
jjansen4@unl.edu
Roger Wilson, 402-472-1771
Department of Agricultural Economics
University of Nebraska-Lincoln
rwilson6@unl.edu