Cornhusker Economics December 9, 2015Mobile Broadband in Nebraska
Mobile Broadband Coverage in Nebraska- Is mobile broadband coverage available throughout Nebraska?
- Is there a difference between rural and urban areas with respect to mobile wireless speed?
- Should mobile wireless coverage be classified as broadband?
Methodology
In order to collect data, the PSC contracted with Mobile Pulse for the use of its mobile wireless network testing app. The app, free to users, ran periodic speed and connectivity tests in the background of any cellular-network enabled device onto which it was installed. The results of those tests were available to the PSC for analysis. Collection of meaningful data relied on running as many tests as possible within a geographically diverse area in Nebraska on as many carriers’ networks as possible.
While data was collected continuously between October 2013 and May 2015, it was essentially collected in two phases: Pre-drive-testing and post-drive testing. The pre -drive-testing phase focused on efforts to encourage the general public to download, install, and use the app; i.e., – a crowdsourcing model. Towards the end of 2014, it became apparent that for all carriers except Verizon, there were too few tests with poor spatial distribution across the state to complete a reasonable assessment of carriers. A plan for manual drive testing was developed to address both of these conditions. Carriers AT&T, U. S. Cellular, Verizon, and Viaero provided demonstration devices that were utilized for testing. Sprint elected not to participate in the drive testing portion of the study. The drive-testing period commenced in April 2015 and was completed by the end of May 2015. The results presented in this article utilize data collected during the entire period encompassing both pre- and post-drive-testing (October 2013 to May 2015).
Upload and Download Speeds
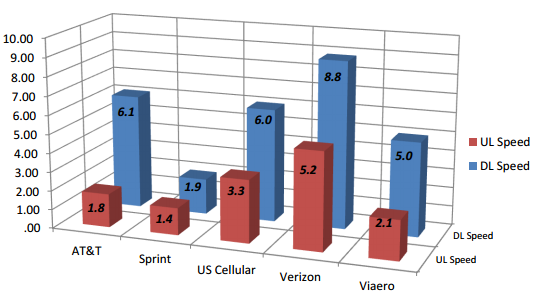
Upload and download speeds are one metric that can be used to measure carrier network performance. This metric, in megabits per second (Mbps), is commonly used when discussing broadband speeds provided by both wireline and wireless carriers. In fact, the FCC has defined broadband by the upload and download speeds of a connection. Recently, the FCC modified their definition of broadband for purposes of compliance with Section 706 of the 1996 Telecommunications Act, from 4 Mbps download and 1 Mbps upload, to 25 Mbps download and 3 Mbps upload. For wireless carriers in Nebraska, upload and download speeds were the highest for Verizon (See Figure 1), followed by AT&T, U.S. Cellular, and Viaero. Sprint was the slowest of the 5 providers. When compared to the previous FCC definition of broadband (4 Mbps download, 1 Mbps upload), 4 of the 5 providers (Verizon, US Cellular, and AT&T) met the threshold (Figure 1). Only one carrier (Sprint) did not meet the threshold.
Looking at individual measurements for each company provides some additional detail regarding the 4/1 FCC broadband definition. Table 1 shows the number and percentage of tests for each provider that met the broadband threshold. Verizon, at 64% of all tests meeting the broadband threshold, is the highest percentage of the five providers, followed by U.S. Cellular (60%), Viaero (58%), AT&T (47%), and Sprint (14%), respectively.
| Provider | AT&T | Sprint | US Cellular | Verizon | Viaero |
|---|---|---|---|---|---|
| Meets 4/1 Broadband | 3,212 | 198 | 2,624 | 12,639 | 4,639 |
| Total Measurements | 6,847 | 1,429 | 4,369 | 19,658 | 8,010 |
| % Meeting BB Definition | 47% | 14% | 60% | 64% | 58% |
Table 2 shows the test results when all speed tests are compared to the FCC’s new broadband definition (25 Mbps download and 3 Mbps upload). In this scenario, only 675 of 40,313 total tests (1.7%) met that threshold, and of those 675, 635 were on the Verizon network (the other 40 were on the AT&T network). It would be difficult to define wireless carriers as broadband providers under the Section 706 FCC definition.
| Provider | AT&T | Sprint | US Cellular | Verizon | Viaero |
|---|---|---|---|---|---|
| Meets 25/3 Broadband | 40 | 0 | 0 | 635 | 0 |
| Total Measurements | 6,847 | 1,429 | 4,369 | 19,658 | 8,010 |
| % Meeting BB Definition | 1% | 0% | 0% | 3% | 0% |
Rural and Urban Differences
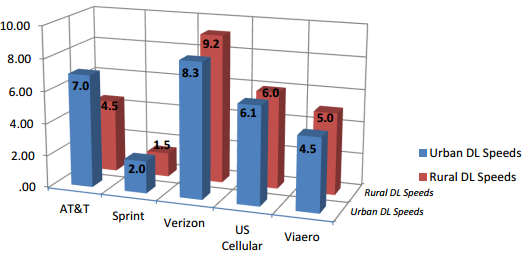
In Nebraska, there is often a perception among users that a wide divide exists between rural and urban areas. With respect to mobile wireless speeds, the spatial nature of the data collected using the app allows that perception to be tested. For the purpose of this analysis, urban tests were considered to be those collected within the city limits of any community in Nebraska. Those tests collected outside of city limits were considered rural tests. Of the five carriers tested, AT&T and Sprint had download speeds that were significantly faster in urban areas (Figure 2). U.S. Cellular download speeds were nearly identical between rural and urban areas while Verizon and Viaero download speeds were faster in rural areas than in urban areas (Figure 2). Upload speeds were faster in urban areas for 4 of the 5 carriers (Viaero was the exception). However, the differences between rural and urban tests for all 4 of those carriers was less than 1 Mbps, and the rural/urban upload speed difference for Viaero was only 0.2 Mbps (Figure not shown).
Latency/Connectivity
The Mobile Pulse app takes connectivity tests in addition to speed tests. While these tests do not collect speed information, they determine whether the device can connect to a network. For this reason, connectivity, defined as the percentage of tests that successfully connect to the network, can be analyzed wherever a latency test is collected. And because more latency tests are performed, additional locations can be analyzed for connectivity versus speed. Results were initially analyzed on a statewide basis for each carrier; i.e., all tests for each carrier were analyzed regardless of location. Connectivity ranged from 80% (Sprint) to 97% (Viaero) among the five carriers tested. All four of the carriers that participated in drive testing (AT&T, US Cellular, Verizon, and Viaero) were above 90%. Statewide maps showing the latency/connectivity breakdown are available in the full report. Key observations by carrier include:
- AT&T data shows that devices on their network are often successful at connecting to an AT&T network even when outside of its advertised area. The advertised area is primarily eastern Nebraska and the state border counties.
- The Sprint connectivity results are predominantly confined to within its advertised footprint, which is concentrated on the larger population centers in eastern Nebraska. These results indicate a network that is smaller than most of the other providers, with lower connectivity as well.
- U.S. Cellular latency results show high levels of connectivity (90%) within their advertised footprint. Coverage area includes the majority of Central and Eastern Nebraska. Their advertised footprint is the second largest, next to Verizon, and their network showed the highest percentage of tests that met or exceeded the advertised speed tier.
- The Verizon footprint covers nearly the entire state, and tests that happened to be performed outside of that footprint usually failed, though there were few of them. When taken into account with the high connectivity figure (91%) the results indicate a robust network that was accurately reported.
- The Viaero latency test results show the highest levels of connectivity among the five providers tested (97/98%). Unlike the other four providers, the majority of the tests are in the western portion of the state, which is consistent with their advertised footprint.
Conclusion
While this report contains information that could be very helpful for consumers who are looking at provider information, there is an additional factor that was not addressed at all in this report – cost. The number and variety of mobile wireless plans add an additional layer of complexity and choice that consumers must factor when deciding on a mobile wireless carrier.
This report also does not directly address the fact that the mobile wireless market is ever-changing, especially regarding coverage areas and device capabilities. It is recognized that tests from over a year ago may not accurately reflect the current situation as it relates to coverage and connectivity. While much effort was made to collect data in as many areas as possible, there are many areas off of paved highways and roadways for which data was not collected, including fields and homesteads that may be important to the agricultural community. Also, the footprints of carriers are in constant flux, with new towers being built and older technology being replaced. Using footprint data that is essentially a year old is not ideal, but it was the best publicly available dataset at the time. It is recommended that carriers continue to report as accurately as possible their footprint and speed tier offerings when submitting data to the FCC or other collecting entities.
Full PSC report
Contact Cullen Robbins at 402-471-0230 or cullen.robbins@nebraska.gov for more information.
The Nebraska Universal Service Fund (NUSF), managed by the PSC, supports the provision of broadband telecommunications infrastructure in unserved and underserved areas of the state through the Broadband Program. More information about the NUSF Broadband Program
Nebraska Broadband Initiative partners are available to meet with communities and regions to answer questions. If you are interested in exploring how to increase your community or region’s broadband capabilities, please contact Anne Byers anne.byers@nebraska.gov/402 471-3805, Charlotte Narjes cnarjes1@unl.edu/402 472-1724) or Connie Hancock chancock1@unl.edu/ 308-254-4455).
For more information about the Nebraska Broadband Initiative, visit http://broadband.nebraska.gov.
Broadband planning team members include Gene Hand and Cullen Robbins, Nebraska Public Service Commission: Anne Byers, Nebraska Information and Technology Commission; Allison Hatch, State of Nebraska Department of Economic Development; Charlotte Narjes and Becky Vogt, UNL Agricultural Economics; Connie Hancock, UNL Extension-Cheyenne County; Rod Armstrong, AIM.
Charlotte Narjes
Dept. of Agricultural Economics
University of Nebraska-Lincoln
402-472-1724
cnarjes@unl.edu
Cullen Robbins
Nebraska Public Service Commission
402-471-0230
cullen.robbins@nebraska.gov
Becky Vogt
Dept. of Agricultural Economics
University of Nebraska-Lincoln
402-329-6251
rvogt2@unl.edu
Topic: