Cornhusker Economics January 6, 2016Satisfaction with Community Services in Rural Nebraska
The Nebraska Rural Poll celebrated its 20th year this fall. The goal of the Rural Poll has been to give rural Nebraskans and their leaders a better understanding of the issues, challenges and concerns of Nebraska’s rural citizens. For twenty years, this annual effort has focused on topics such as community, government policy, the environment, well-being and work. While the Poll has collected information from a number of different topics ranging from taxes to climate change, a number of core questions included each year are providing insights about trends and changes occurring in rural Nebraska. Some of those questions that are repeated each year measure rural Nebraskans’ satisfaction with a list of community services. This paper will examine the trends in satisfaction levels with a subset of those community services.Respondents each year are asked how satisfied they are with various community services and amenities. They were asked this in all twenty studies; however, in 1996 they were also asked about the availability of these services. Therefore, comparisons are only made between the last nineteen studies, when the question wording was identical. The respondents were asked how satisfied they were with a list of 25 services and amenities, taking into consideration availability, cost, and quality.
Overall, each year rural Nebraskans report high levels of satisfaction with many services, but other services and amenities have higher levels of dissatisfaction. Typically, only a few services listed have a higher proportion of dissatisfied responses than satisfied responses and those services are largely unavailable in rural communities (entertainment, retail shopping, arts/cultural activities, and public transportation services). The services or amenities respondents are most satisfied with each year usually include services such as: fire protection, parks and recreation, library services, religious organizations, and education (K-12). The services that normally have the highest levels of dissatisfaction include entertainment, retail shopping, streets and roads, restaurants, arts/cultural activities, and housing.
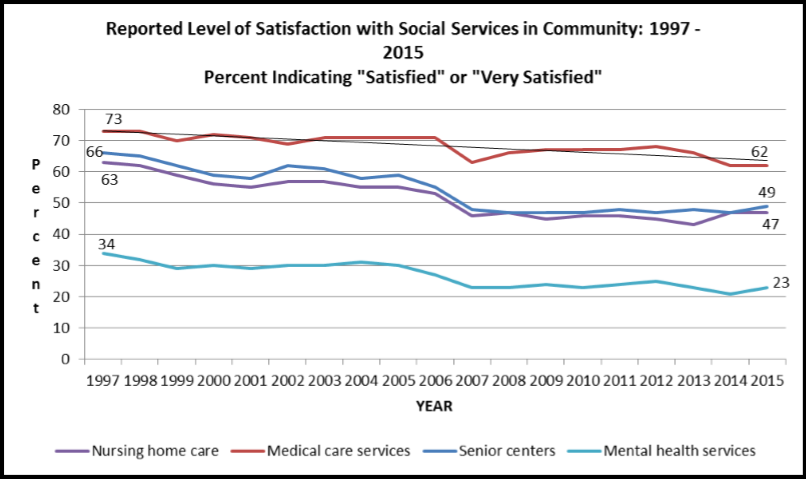
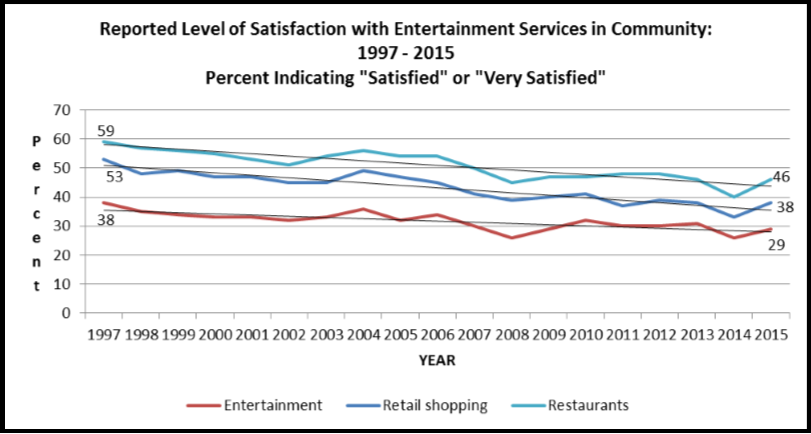
The rank ordering of all these services has remained relatively stable over the nineteen years. However, some of the services have experienced steady declines across all 19 years of the study. Two broad categories of services in particular have seen such declines: social services and entertainment services. As an example, the proportion of rural Nebraskans satisfied with nursing home care has dropped from 63 percent in 1997 to 47 percent this year. Similar declines are seen with other social services: medical care services, senior centers, and mental health services. In addition, satisfaction with entertainment services (entertainment, retail shopping and restaurants) have also generally declined over the past nineteen years. Satisfaction with retail shopping has declined from 53 percent in 1997 to 38 percent this year.
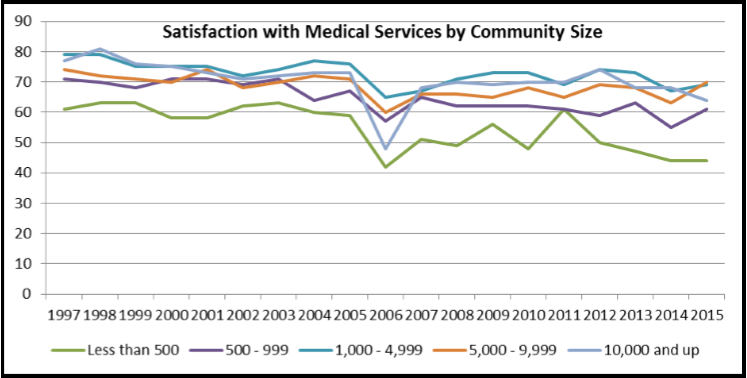
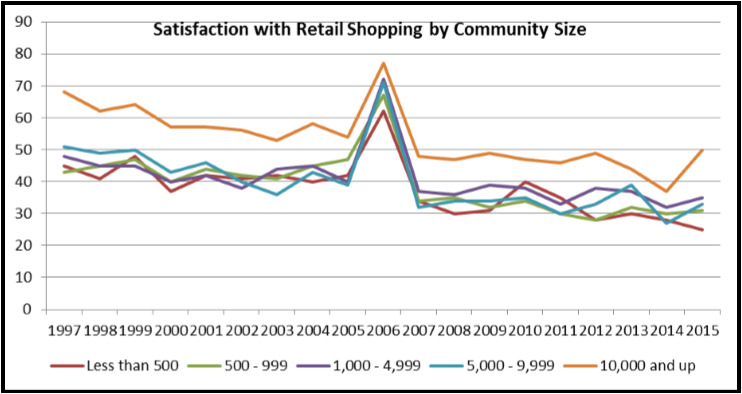
While these overall trends are interesting by themselves, it is also useful to see if these same steady declines are evident across different community sizes. Satisfaction levels with medical care services by community size yield some interesting results. A surprising finding is that mid-sized communities (populations ranging from 1,000 to 4,999) generally have the highest satisfaction ratings for medical care services each year. While all community size classes show somewhat steady declines in satisfaction across all 19 years, the smallest communities have the greatest variability in their data. It is also interesting that all community sizes had dramatic declines in 2006, though the mid-sized communities had smaller declines. The most dramatic declines that year are seen in both the largest and smallest community sizes. When looking at the satisfaction levels with retail shopping, we see the expected pattern of larger community sizes with higher levels of satisfaction as compared with smaller communities. Again, 2006 stands out, however, this time spikes in satisfaction levels are seen that year across all community sizes. And, steady declines (with the exception of 2006) occur across all the community sizes for all 19 years.
It is hard to know what caused the fluctuations in 2006. That year the state was in the middle of a drought. This wasn’t reflected in our annual well-being variables (which remained about the same as 2005), but rural Nebraskans were generally more positive about their community that year. That seems to be reflected in the uptick in satisfaction with retail shopping, but not the declines for medical care services.
These trends in satisfaction levels with community services should be of interest to community and economic developers who are looking to both attract new population to their areas as well as retain their current population. These types of community services have been shown to influence overall satisfaction with the community. Thus, it is important to explore further what is causing these declines in satisfaction and to find ways to improve these services in rural communities.


Becky Vogt
Dept. of Agricultural Economics
University of Nebraska-Lincoln
402-329-6251
rvogt2@unl.edu
Topic: