The 2015 state average for Nebraska agricultural land values declined two percent from 2014, according to the final results of the University of Nebraska-Lincoln Farm Real Estate Market Survey. The state-wide all-land average value for the year ending February 1, 2015, averaged $3,250 per acre, down $65 per acre from 2014.
Highlights
Changes in the value of the all-land category across the entire state of Nebraska for the year ending February 1, 2015 averaged a slight decline of about 2 percent. The figure below summarizes these averages along with the percent changes over last year's all-land average for the eight regions of the State.
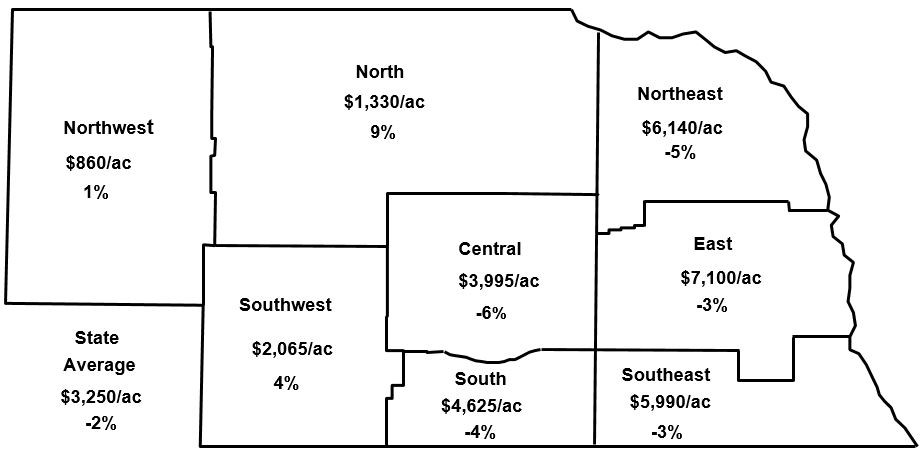
- The statewide all-land average value for the year ending February 1, 2015 averaged $3,250 per acre equating to approximately 2 percent ($65 per acre) decline over last year's value of $3,315 per acre.
- Changes in the all-land average varied across Nebraska with the Central, East, Northeast, South, and Southeast declines averaging around 5 percent; whereas the North and Northwest increased at 1 and 9 percent, respectively.
- Current livestock prices fueled the largest increases in grazing and hayland values according to panel members. General expectations for these two land classes remain bullish correlating with anticipated higher cattle prices.
- Current crop prices were listed as the most negative factor by survey participants leading to the decline of dryland and irrigated cropland in Nebraska. Panel members listed farm input costs associated with crop production as the second most important factor leading to the decline of agricultural land.
| Type of Land | Northwest | North | Northeast | Central | East | Southwest | South | Southeast | State |
|---|---|---|---|---|---|---|---|---|---|
| Dryland Cropland (No Irrigation Potential) | |||||||||
|
$/acre |
730 -14 |
1,580 -8 |
5,645 -12 |
3,115 -11 |
5,980 -9 |
1,966 -6 |
3,340 -4 |
5,060 -7 |
3,390 -9 |
| Dryland Cropland (Irrigation Potential) | |||||||||
|
$/acre |
870 -7 |
2,290 -4 |
7,065 -2 |
4,095 -17 |
7,310 -3 |
1,950 -4 |
4,510 -11 |
6,940 -2 |
5,030 -4 |
| Grazing Land (Tillable) | |||||||||
|
$/acre |
535 |
1,395 21 |
3,695 -9 |
2,615 14 |
4,205 16 |
1,135 28 |
2,350 -3 |
3,035 -8 |
1,515 9 |
| Grazing Land (Nontillable) | |||||||||
|
$/acre |
490 21 |
745 |
2,580 4 |
2,030 22 |
3,010 20 |
945 17 |
1,815 2 |
2,275 5 |
1,005 16 |
| Hayland | |||||||||
|
$/acre |
1,115 9 |
1,905 15 |
3,630 25 |
2,890 23 |
4,080 24 |
1,965 27 |
2,955 26 |
3,100 23 |
2,355 20 |
| Gravity Irrigated Cropland | |||||||||
|
$/acre |
3,235 6 |
4,135 -2 |
7,355 1 |
6,905 -14 |
8,445 -3 |
4,435 -2 |
7,095 -3 |
7,995 -4 |
6,900 -6 |
| Center Pivot Irrigated Cropland | |||||||||
| $/acre % change |
3,625 |
4,835 -3 |
8,150 -8 |
7,825 -12 |
9,575 -3 |
5,790 1 |
8,270 -2 |
9,425 -3 |
7,315 -5 |
| All Land Average | |||||||||
|
$/acre |
860 1 |
1,330 9 |
6,140 -5 |
3,955 -6 |
7,100 -3 |
2,065 4 |
4,625 -4 |
5,900 -3 |
3,250 -2 |
- The overall changes in values across Nebraska depended upon whether the land class was cropland versus grazing land or hayland which are primarily utilized by cattle producers. On average, the all land average value deceased by about 2 percent with the higher rates of decline primarily occurring in districts largely composed of dryland or irrigated cropland.
- Hayland used for forage production led the state with the largest increase in value of 20 percent. Grazing land (nontillable) closely followed the hayland land average with an increase over 2014 of 16 percent. These two land classes are the primary resources which cow-calf producers utilize. As the expected prices for calves remain strong for 2015, the industry participants were more willing to bid up the price of these land resources.
- Over the last 3 to 5 years, dryland and cropland land values lead Nebraska in the increases of land values. This strong growth was hard to maintain into 2015 as returns for crops declined while input costs remained fairly constant.
- Dryland cropland values followed a trend comparable to the irrigated land classes. Declines for the state ranged between 5 and 10 percent. Panel members noted the rate of decline for cropland has been higher for more marginal parcels of ground compared to higher quality tracts.