
Content
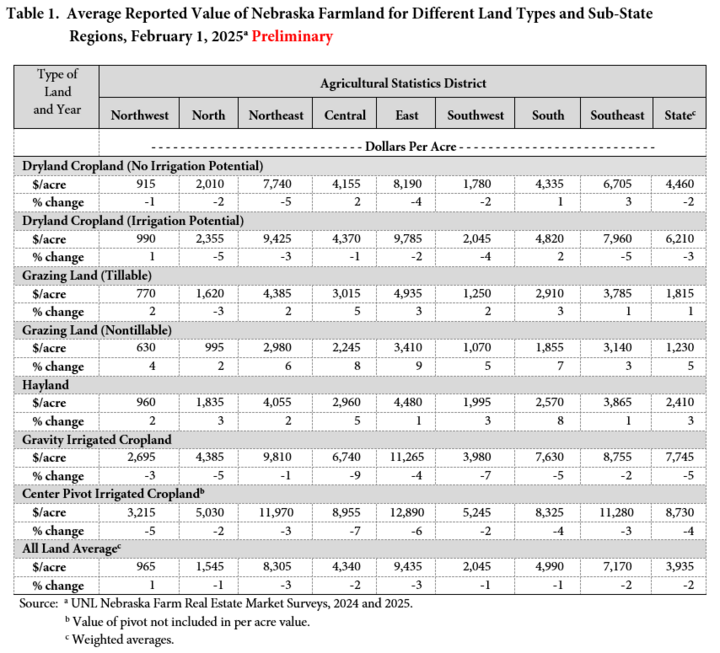
The market value of agricultural land in Nebraska declined by 2% over the prior year to an average of $3,935 per acre, according to the 2025 Nebraska Farm Real Estate Market Survey (Figure 1 and Table 1). This marks the first decline in the market value of agricultural land in Nebraska since reaching the record non-inflation-adjusted statewide land value in the survey's 46-year history in 2024.
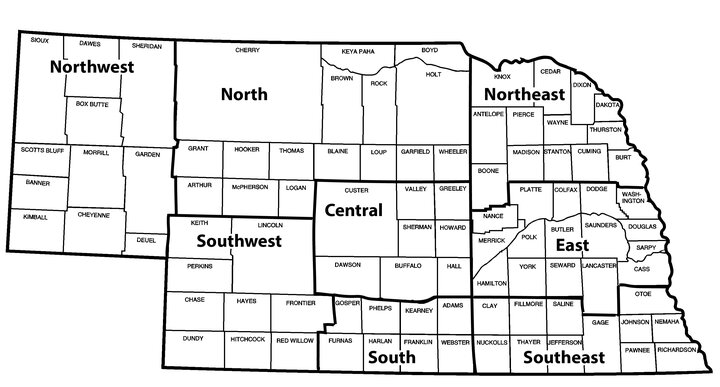
The University of Nebraska-Lincoln’s Department of Agricultural Economics annually surveys land industry professionals across Nebraska, including appraisers, farm and ranch managers, agricultural bankers, and related industry professionals. Results from the survey are divided by land class and summarized by the eight Agricultural Statistic Districts of Nebraska (Figure 2).
Land industry professionals responding to the annual survey attributed the drop in Nebraska agricultural real estate values to current crop prices, interest rate levels, and farm input costs commonly used by operations across the state. Lower crop prices for commodities grown across the state have tightened the financial positions of many operations. Interest rates have raised borrowing costs for loans used for leasing or real estate purchases. Farm input costs and current interest rates present elevated financial pressure and influence land or agricultural equipment investment decisions.
Net farm income in Nebraska decreased by about 17% to $7.69 billion in 2024 due to lower crop prices. Lower corn and soybean prices reduced crop receipts across the state by about $1.59 billion but were partially offset by higher cattle and calf prices of $1.09 billion (Lubben, 2024). The differences in crop and livestock profitability were reflected in the market value of the land classes serving each industry. Forecasts for Nebraska indicate that net farm income will further decline in 2025 due to ongoing crop prices and input expenses.
Figure 1. Historic Nebraska Average Land Value 1980-2025a
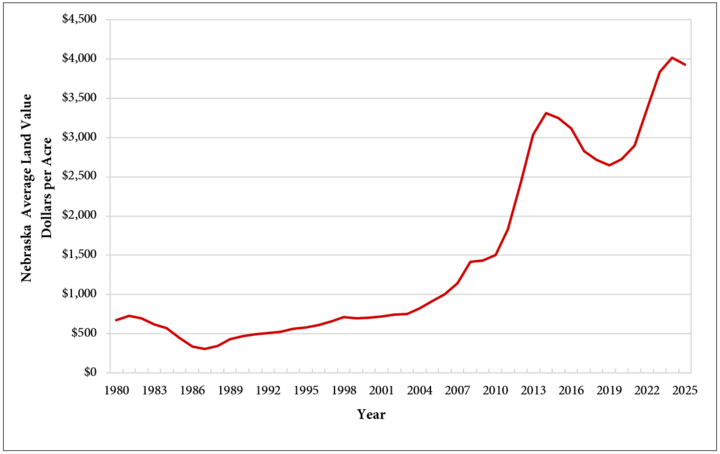
Source: a UNL Nebraska Farm Real Estate Market Surveys, 1980-2025.
Figure 2. Nebraska Agricultural Statistics Districts
Financial forces in the agricultural economy dampened activity in land markets as short- and long-term loans stayed at multi-decade highs without additional income to offset this expense. Lenders across the states in the Tenth District of the Federal Reserve Bank of Kansas City noted the tightening financials of many operations with lower income and liquidity positions. The share of land purchased by farmers or ranchers declined to approximately 75% across these states (Kreitman & Kauffman, 2024a).
Farm input expenses and interest rates have raised financing costs for many operations. These factors could pose financial challenges for operations with significant debt (Kauffman & Kreitman, 2024b). Capital spending on equipment and related investments has slowed due to tightening financial conditions (Kauffman & Kreitman, 2024a). Survey participants reported that the financial positions of operations guided the real estate markets for cropland and grazing land.
The estimated market value of dryland cropland without irrigation potential decreased by 2% statewide compared to the prior year (Table 1). North, Northeast, East, and Southwest Districts declined by 2% to 5%. The average change in the other four districts ranged from -1% to 3%. Dryland cropland with irrigation potential declined 3% for the state. Districts in the North, Northeast, Southwest, and Southeast reported declines ranging from 3% to 5%, whereas the other regions reported changes ranging from -2% to 2%. The motivation to develop irrigation decreases as crop prices fall.
Center pivot irrigated cropland averaged 4% lower in 2025, with decreases in the North, Central, and East ranging from 4% to 7%. The Northeast, South, and Southeast fell between 3% and 4%, while the North and Southwest declined 2%. Modest losses also extended to gravity irrigated cropland, with an average decrease of 5% in 2025. Changes in the market value ranged from a 9% loss in the Central to a 1% decline in the Northeast. Declines in the market value for irrigated land classes follow lower crop price expectations for 2025.
The grazing land and hayland values increased from 1% to 5%. Nontillable grazing land led the three land classes at a 5% increase as market competition for additional acres followed rising prices. Northeast, Central, East, Southwest, and South Districts reported gains between 6% and 9%. Hayland followed with an increase of 3%, and tillable grazing land followed with a gain of 6%. Cow-calf producers capitalized higher calf prices into these three land classes across the state.
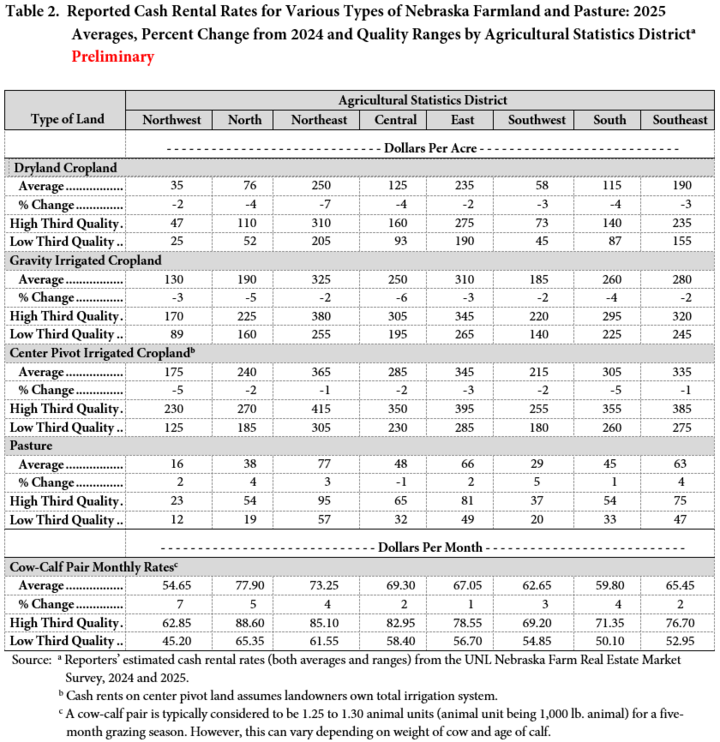
Dryland and irrigated cropland rental rates trended lower across Nebraska in 2025 (Table 2). Survey participants indicated that lower crop prices contributed to declining cropland rental rates. Favorable crop production across major grain-producing regions of the United States in 2024 has positioned prices lower for the upcoming growing season. Input prices for seed, fertilizer, and chemicals have stabilized but remain high for critical inputs. Including flexible lease provisions can help reduce price uncertainty and production risks when setting up a cash lease agreement for the upcoming year.
Cash rental rates for dryland and irrigated cropland reported declines ranging from 1% to 7% over the prior growing season. The cash rental rates for irrigated cropland assume that the landlord owns the entire irrigation system. If the tenant provides any irrigation system component, the rental rate will be adjusted downward to account for this contribution. Survey participants indicated concerns about drought, input costs, and water availability in specific areas for the growing season. Considering actual revenue, production costs, and irrigation constraints may be important features for a flexible lease in 2025.
Rental rates for pasture and cow-calf pairs rose across Nebraska in 2025 (Table 2). The rates increased by approximately 3% to 4% compared to the previous grazing season. Rising cash rental rates for grazing land are linked to increased cattle prices and shifts in national livestock inventories. Cash rental negotiations should incorporate early removal provisions to address drought considerations for the upcoming growing season.
The level of service provided by the landlord or tenant affects the rental rates for cow-calf pairs included in the lease. Considerations for the leases involve the party responsible for maintaining fences, controlling noxious weeds or brush, and paying utility bills for livestock wells. As indicated in Table 2, the high third quality for cash rent may reflect some of these negotiated lease provisions.
Land values and rental rates presented in this report are averages of survey participants’ responses by district. Actual land values and rental rates may vary depending on the quality of the parcel and the local market for an area. Also, preliminary land values and rental rates are subject to change with the return of additional surveys. Final results from the survey will be published in June 2025 and available online via the Nebraska Farm Real Estate website: http://cap.unl.edu/realestate
Please address questions regarding preliminary estimates from the 2025 Nebraska Farm Real Estate Survey to Jim Jansen at (402) 261-7572 or jjansen4@unl.edu.
References
Kreitman, T., & Kauffman, N. (2025, February 13). Farmland Values Flattened Amid Modest Deterioration in Credit Conditions, retrieved March 6, 2025, from the Kansas City FED.
Kreitman, T., & Kauffman, N. (2025, March 6). Farm Real Estate Values were Steady in 2024, retrieved March 7, 2025, from the Kansas City FED
Lubben, B. (2024, October 1). Fall 2024 Nebraska Farm Income Outlook, retrieved March 6, 2025, from the Rural & Farm Finance Policy Analysis Center.
Jim Jansen
Agricultural Economist
Department of Agricultural Economics
University of Nebraska-Lincoln
jjansen4@unl.edu
(402) 261-7572