
Content
By Daniela Mattos
1. Introduction and Methodology
This report examines whether the undergraduate demographics in the Colleges of Agriculture at four Midwestern land-grant universities—UNL (CASNR), Iowa State (CALS), Kansas State (Ag), and Missouri (CAFNR)—are keeping pace with the increasing diversity of their respective states, with a special focus on Underrepresented Minority (URM) students. This analysis is urgent because, despite some progress, most Colleges of Agriculture still enroll a smaller URM share than their states, and Black and Hispanic workers remain underrepresented in the STEM workforce (National Science Board & National Center for Science and Engineering Statistics, 2024). Furthermore, the region's recent growth has been disproportionately driven by people of color (Kayitsinga, 2022), emphasizing the need for these land-grant institutions to better reflect the populations they serve.
How the Analysis Was Done
The analysis uses FAEIS (Food and Agriculture Education Information System (2019-2024)) data to measure shortfalls at the entry point, flag specific program clusters that are lagging, and summarize effective strategies used by peer institutions to close these gaps.
- Population: Domestic undergraduate students at the fall census, counted by their first major within the College of Agriculture.
- URM Definition: URM is defined as URM (Hispanic/Latino of any race) plus Black/African American, American Indian/Alaska Native, Native Hawaiian/Other Pacific Islander; "Two or More Races" is excluded.
- Core Metrics:
- URM Share: The percentage of domestic undergraduates who are URM.
- URM Gap: State URM benchmark minus the college's URM share (in percentage points, pp).
- Representation Index (RI): College URM Share \ State URM Share, where RI = 1.00 indicates parity.
- State Benchmarks (ACS 2024):
- All-Ages URM: Percent of state residents of all ages.
- Ages 10–24 URM: Used as a proxy for the youth pipeline into agriculture majors.
Interpretation note: Results are consistent with an entry-point shortfall; however, we cannot attribute causality with the current data.
2. Results: Benchmarks and Performance
State Benchmarks and Youth Pipeline Diversity
Across all states, the URM share for the Ages 10–24 demographic exceeds the All-Ages URM share by about 3–4 percentage points, indicating a more diverse youth pipeline than the general population.
Table 1: State URM Benchmarks (ACS 2024)
| State | All Ages (URM) | Ages 10–24 (URM) |
|---|---|---|
| Iowa | 12.3% | 15.8% |
| Kansas | 19.9% | 23.9% |
| Missouri | 16.3% | 20.3% |
| Nebraska | 18.8% | 21.8% |
Source: U.S. Census Bureau, American Community Survey (ACS) 2024 1-year estimates (state benchmarks); Author’s calculations.
For UNL CASNR, the state youth URM is roughly 21–22%, while the college's undergraduate URM share sits near 4%. This significant gap highlights the need for front-end interventions focusing on recruitment and early success pathways.
College Performance vs. State Benchmarks (2024)
All four Colleges of Agriculture lag behind their state benchmarks for URM share in 2024. This lag is compounded when the focus shifts to the more diverse Ages 10–24 benchmark.
The UNL CASNR is the clear outlier, with its undergraduate URM share around 4% vs. state youth URM of 21–22%. The magnitude of CASNR's shortfall suggests structural barriers at entry or early program stages, dominating the under-representation across the peer colleges.
Table 2: Estimated URM Gaps for Midwest Colleges of Agriculture vs. State Benchmarks (2024)
| College | All-Ages URM Gap (pp) | Est. Ages 10–24 URM Gap (pp) |
|---|---|---|
| UNL (CASNR) | 15.2 | 18.2 |
| Iowa State (CALS) | 4.1 | 7.6 |
| Kansas State (Ag) | 10.0 | 14.0 |
| Missouri (CAFNR) | 6.4 | 10.4 |
Source: U.S. Census Bureau, American Community Survey (ACS) 2024 1-year estimates (state benchmarks); FAEIS college shares; Author’s calculations.
3. Shortfall Concentration and Multi-Year Trends
Shortfalls Concentrated in Entry-Point Clusters
Under-representation concentrates on a few large, entry-point program clusters. The most visible shortfalls are in Ag Public Services (strong at Iowa State) and Ag Econ / Ag Bus & Manag. (notably at Iowa State and Missouri), with additional pockets in Plant Sciences.
Figure 1. Program-cluster heatmap (flags, 2024)
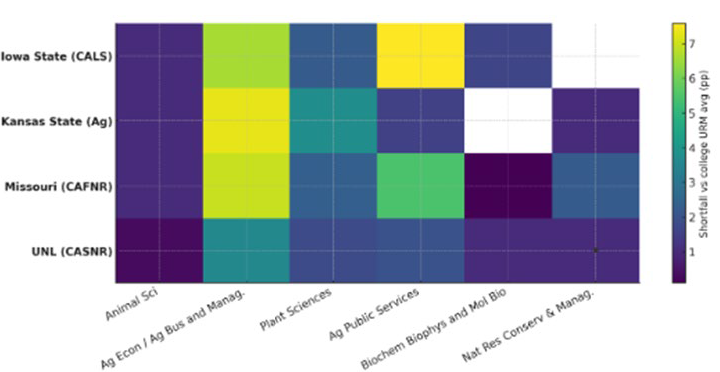
Source: FAEIS college shares, 2024; U.S. Census Bureau, ACS 2024 1-year (state benchmarks). Author’s calculations. Note: Flags indicate where shortfalls concentrate—either ≥3 pp below a college’s own average or RI ≤ 0.75 relative to its state benchmark.
- Strategy Tip: Since these clusters enroll many students, small percentage gains in them will move the college-level totals more than equal gains in smaller clusters. The heatmap points directly to where marginal effort has the largest payoff.
- UNL CASNR Takeaway: Among the six analyzed clusters, CASNR generally shows smaller shortfalls (darker tiles) and correspondingly fewer flags (cells ≥3 pp below the college average or RI ≤ 0.75). This points to a college-wide entry-point shortfall rather than a few outlier programs lagging far below the college average. Multi-Year Representation Index (RI: College URM \ State URM)
Over the years, several colleges increased raw URM shares, but the RI often remained below parity (RI = 1.00) as state benchmarks rose. The persistence of the RI gap underscores the need for integrated, long-term strategies.
Table 3: Multi-Year Representation Index (RI) for Colleges of Agriculture (2019–2024)
| College | 2019 | 2021 | 2022 | 2023 | 2024 |
|---|---|---|---|---|---|
| UNL (CASNR) | 0.414 | 0.503 | 0.506 | 0.475 | 0.191 |
| Iowa State (CALS) | 0.849 | 0.819 | 0.736 | 0.713 | 0.667 |
| Kansas State (Ag) | 0.368 | 0.393 | 0.459 | 0.479 | 0.497 |
| Missouri (CAFNR) | 0.562 | 0.622 | 0.615 | 0.577 | 0.607 |
Source: U.S. Census Bureau, American Community Survey (ACS) 2019–2024 1-year estimates (state benchmarks); FAEIS; Author’s calculations. Note: The Census Bureau did not publish standard ACS 1-year estimates for 2020 due to COVID-19 collection disruptions.
In 2024, the RI for all four colleges ranges from roughly 0.19 to 0.67, which is well below parity. For UNL CASNR, raw gains in URM share are not sufficient; CASNR must pursue coordinated, sustained front-door recruitment/yield efforts and transfer-readiness pathways to move RI toward parity.
4. Evidence-Backed Strategies and Conclusion
Evidence-Backed Strategies for URM Representation
External evidence aligns with the playbook adopted by peer universities to narrow representation gaps for underrepresented minority (URM) students (Alston, Roberts, & Warren English, 2019). Proven strategies include:
- Integrated Bridge Programs: Summer-to-fall bridge programs and Supplemental Instruction/Learning Assistants improve first-year GPA, pass rates, and persistence in gateway science courses (Bradford, Beier, & Oswald, 2021; Dawson, 2014; NASEM, 2016).
- Transfer Pathways: 2+2 transfer maps reduce well-documented credit loss and uncertainty for transfer students (GAO, 2017; Jenkins & Fink, 2016; NASEM, 2016).
- Early Applied Experiences: Early paid research/fieldwork/internships strengthen belonging and persistence, with agriculture-specific evidence showing measurable learning and skill gains (NASEM, 2017; Rastegari Henneberry & Radmehr, 2020).
- Support Communities: Using MANRRS (Minorities in Agriculture, Natural Resources, and Related Sciences) serves as both a recruitment bridge and a supportive community that sustains persistence (MANRRS, n.d.).
The Urgency for UNL CASNR
The URM representation gap at UNL CASNR is severe and demands an urgent escalation of effort, as the current pace of change is clearly insufficient to reach parity. The core challenge for CASNR is its reliance on small/rural pipelines, where limited early exposure to challenging math, chemistry, and statistics sequences quickly compound entry-point gaps and leads to a high DFW (D/F/Withdrawal) risk.
To address this systemic issue, CASNR requires a dual strategic response:
- Intensify Efforts: Significantly scale up evidence-backed efforts like implementing summer-to-fall bridges with embedded support, mapping 2+2 transfer pathways, and integrating early paid applied experiences.
- Innovate: Simultaneously explore and implement innovations that target fundamental shifts in institutional culture, such as integrating inclusive practices into curriculum design and expanding pipeline partnerships into new geographies to fully align enrollment with the rapidly diversifying Midwest.
Conclusion
The analysis confirms that all four Midwest Colleges of Agriculture trail their state URM benchmarks. UNL CASNR faces the most severe gap, which is primarily an entry-point shortfall that severely constrains its overall URM representation. The persistence of the RI gap across all institutions, despite some raw gains, emphasizes the need for coordinated, sustained, and integrated strategies that focus on high-impact interventions, especially in large, flagged program clusters, to move decisively toward true parity.
References
Alston, A. J., Roberts, R., & Warren English, C. (2019). Building a sustainable agricultural career pipeline: Effective recruitment and retention practices used by colleges of agriculture in the United States. Journal of Research in Technical Careers, 3(2). https://doi.org/10.9741/2578-2118.1073.
Bradford, B. C., Beier, M. E., & Oswald, F. L. (2021). A meta-analysis of university STEM summer bridge program effectiveness. CBE—Life Sciences Education, 20(2), ar21. https://doi.org/10.1187/cbe.20-03-0046.
Dawson, P. (2014). On the effectiveness of Supplemental Instruction: A systematic review. Review of Educational Research, 84(4), 609–639. https://doi.org/10.3102/0034654314540007.
Jenkins, D., & Fink, J. (2016). Tracking transfer: New measures of institutional and state effectiveness in broadening bachelor’s degree attainment. Community College Research Center. https://ccrc.tc.columbia.edu/publications/tracking-transfer-institutional-state-effectiveness.html.
Kayitsinga, J. (2022). Latino population growth: Community racial-ethnic makeup and socioeconomic well-being in the Midwest. Nexo, 25(2). Julian Samora Research Institute (MSU). https://jsri.msu.edu/publications/nexo.
MANRRS (Minorities in Agriculture, Natural Resources, and Related Sciences). (n.d.). About MANRRS. https://www.manrrs.org/.
National Academies of Sciences, Engineering, and Medicine. (2016). Barriers and opportunities for 2-year and 4-year STEM degrees: Systemic change to support students’ diverse pathways. National Academies Press. https://doi.org/10.17226/21739.
National Academies of Sciences, Engineering, and Medicine. (2017). Undergraduate research experiences for STEM students: Successes, challenges, and opportunities. National Academies Press. https://doi.org/10.17226/24622.
National Science Board & National Center for Science and Engineering Statistics. (2024). The STEM labor force: Scientists, engineers, and skilled technical workers (NSB-2024-5). https://ncses.nsf.gov/pubs/nsb20245/.
Rastegari Henneberry, S., & Radmehr, R. (2020). Quantifying impacts of internships in an international agriculture degree program. PLOS ONE, 15(8), e0237437. https://doi.org/10.1371/journal.pone.0237437.
U.S. Census Bureau. (2019-24). American Community Survey, 1-year estimates: Table B03002 (Hispanic or Latino Origin by Race). https://data.census.gov/table/ACSDT1Y2024.B03002.
U.S. Government Accountability Office. (2017). Higher education: Students need more information to help reduce challenges in transferring college credits (GAO-17-55574). https://www.gao.gov/products/gao-17-574.
Daniela Mattos
Assistant Professor of Practice
Department of Agricultural Economics
University of Nebraska-Lincoln
dmattos2@unl.edu