
Content
Background: In recent years, there has been an interest in expanding the adoption of precision agricultural practices. While definitions can vary, precision agriculture is generally focused on using data from technologies such as sensors and GPS to manage inter- and intra-field variability and adapt input use and other management choices to improve input use efficiency. Though a lot of emphasis in precision agriculture has focused on increasing production and/or reducing input use, the information provided through precision data can also be complementary to conservation practice adoption. USDA (2023) reports that 32% to 45% of farms (excluding small family farms with farm income less than $350,000) have already adopted variable rate technologies, and even more have yield monitor systems.
Public programs such as those funded through the Conservation Title of the United States Farm Bill provide incentives for a range of societal benefits, including water quality protection, habitat management, reduced soil erosion, and many other outcomes. The United States Department of Agriculture's Conservation Reserve Program (USDA CRP) has been an established set-aside program since 1985 and provides incentives to retire full or partial agricultural production fields and establish a conservation land cover. Partial-field conservation use has been adopted in many types of fields, with examples including grassland cover on the corners of a center-pivot field, wetland restoration in a poorly performing portion of a field, or buffer strips on a field’s edge. Starting in 2019, the USDA named prairie strips as a supported practice under the CRP as CP-43. Establishing prairie strips has known environmental and ecological benefits, such as reduced nitrate runoff, improved pollinator populations, and a range of other benefits (Schulte et al., 2017; Khanal et al., 2022), and partial fields can be enrolled, allowing producers to enroll the least productive or profitable portion of a field.
Methods: In a recent publication in the journal Science of the Total Environment (Khanal et al., 2025), we use data from an on-farm precision experiment (OFPE) to optimize the location of a prairie strip (an in-field buffer strip or edge-of-field filter strip) within a production field and evaluate the impact of the prairie strip on profitability and crop insurance premiums. OFPE uses precision farming equipment to experimentally vary input use across a field and measure the resulting yield. The resulting data can be used to estimate cell-specific yield functions that can be optimized to maximize profits. The data from OFPE allows a farmer to use inputs efficiently, applying more inputs to portions of a field that can use those inputs to achieve higher yields, while reducing costly input use on portions of the field that are less profitable. Figure 1 provides an example of the experimental design in the OFPE we use, which is based on experimental work on a corn field in Effingham County, Illinois. The field (see Figure 1(a)) is divided into 1864 experimental cells. Each cell has a width of 40 feet. The fertilizer applicator and harvester were both 20 feet wide. For our analysis, we remove 122 headlands and border cells. The total area of the whole plot is thus 64.1 acres. The plot had six experimental seed rates (25, 29, 32, 35, 39, and 43 1000-seed per acre) and nitrogen fertilizer rates between 108.1 and 249.1 pounds per acre (Figure 1 (b) and (c)). Yield ranged from 50 to 203 bushels per acre (Figure 1(d)).
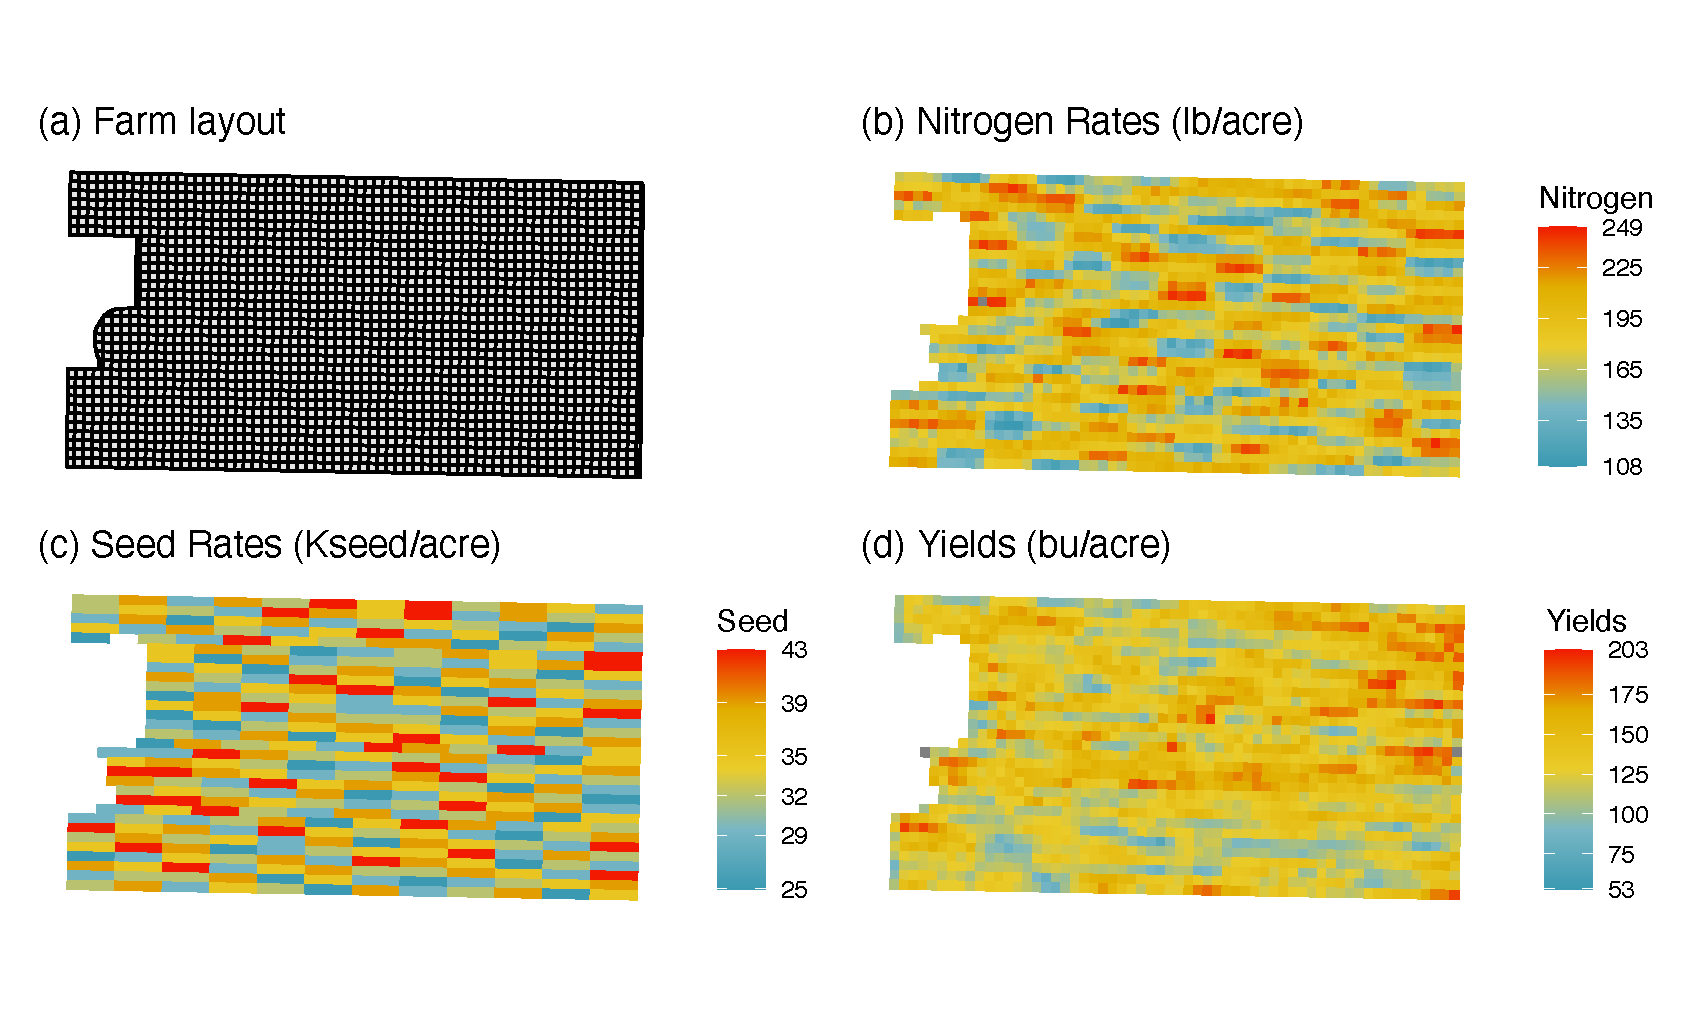
Figure 1: On-Farm Precision Experiment Data
For our analysis, we use a three-step approach as illustrated in Figure 2. For the first step, we use the experimental data shown in Figure 1. Experimental results provide the actual yield, but the actual yield may be based on relatively high or low nitrogen and seed inputs. Using the inputs and yield from the experiment, we estimate a yield function that varies by cell. The output of Step 1 provides cell-specific yield functions that can be used to estimate the expected yield associated with any combination of inputs and can be used to determine profit-maximizing levels of input use under different sets of prices.
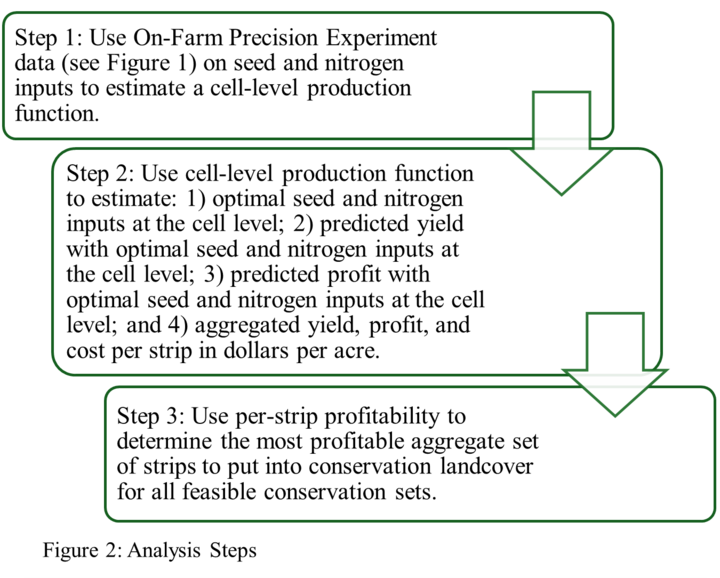
The second step involves several sub-steps (Steps 2.1 – 2.4). For Step 2.1, we use prices from Crop Budget reports (Schnitkey and Swanson, 2019) for the experimental year to calculate the profit-maximizing amounts of seed and nitrogen for each cell. Prices are $3.20 per 1000 seeds, $0.38 per pound of nitrogen fertilizer, and $4.50 per bushel of corn. With this information, a precision application system could be programmed to apply the amount of seed and nitrogen inputs that maximize expected profit. For Step 2.2, we use the optimized input levels to estimate the predicted yield, based on the yield function from Step 1, and then use the Crop Budget report prices to estimate production profit per cell. To calculate total profit (Step 2.3), we use total revenue (estimated yield x corn price), cost of seed and nitrogen (optimized inputs x prices), and an estimate of $386 for other costs (Schnitkey and Swanson, 2019).
The results from 2.3 provide an estimate of profit per cell, but we need to use that information to calculate an expected profit per strip (Step 2.4). We average the profit, cost, and yield from all cells in each strip to calculate values by strip for the 31 strips in the field (see Figure 3).
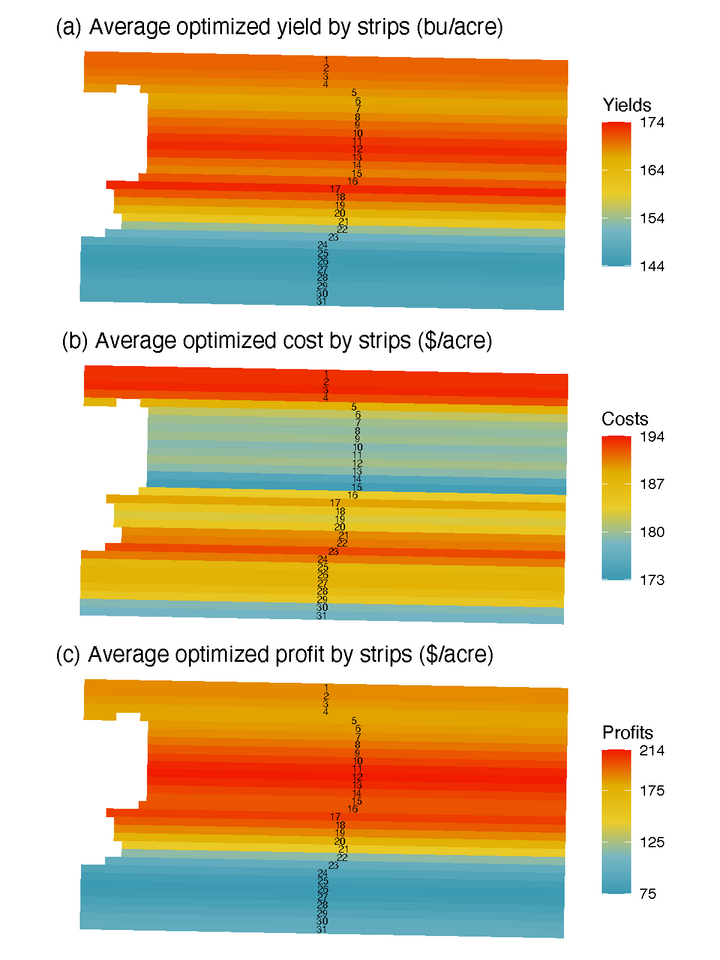
Figure 3: Optimized yield, profit, and cost per strip.
Step 3 requires comparing the total profit for different conservation options. The two extreme options are 1) keep the land entirely in corn production, or 2) retire the entire field and enroll it in CRP. Precision conservation is another option that retires a portion of the field and enrolls it into CRP. With 31 strips in the field, we consider the total profit when we optimize which strips are retired. For example, to analyze retiring one strip, we compare the total profit when each strip is retired, and determine which strip is least profitable. In this field, if only one strip is retired, Strip ID 26 is the most profitable to retire, since it has the lowest average profit. When more than one strip is retired, we require that those strips are adjacent to each other (for example, for the two-strip retirement scenario, we would allow Strip 2 and Strip 3 to be retired, but not Strip 2 and Strip 6). We calculate a return from CRP enrollment for the retired strips based on the county-level CRP rental payment of $164 per acre (based on 2019 rates), with an establishment cost of $30 per acre (Tyndall et al, 2013), providing a net return of $134 per acre under CRP. For partial retirement, we also make the following adjustments to total profit:
- Reduce optimized yield by 2.5% for any new field edges if the strip is in the middle of the field to reflect possible field edge losses.
- Increase the Other Cost estimate to reflect a higher per-acre cost of moving equipment between fields.
- Adjust crop insurance premiums to reflect the updated average yield. We adjust the coverage rate and estimated cost to provide the same yield coverage, with a base rate coverage of 85% when the entire field is farmed. For example, if the optimized yield on the full field is 200 bushels, the insured yield is 170 bushels per acre, or 85% of 200. If the average optimized yield is 220 bushels after partial retirement, the adjusted coverage rate is , or 77.3%. Since insurance coverage is only available for certain percentages (e.g., 70%, 75%, 80%), we calculate the net cost of the insurance premium based on a linear interpolation of the closest included values. For example, if the adjusted coverage rate is 77.5%, we would estimate the cost based on the midpoint between 75% and 80%. Partial field retirement that increases the average yield on a particular field will reduce the cost of insuring the same yield guarantee for two reasons. First, the coverage rate to insure the same yield will be lower. Second, the effective subsidy is higher with lower coverage rates. While our approach is based on maximizing profit (not yield), if the optimized yield is positively correlated with optimized profit, this will lead to lower insurance premiums to maintain a constant yield guarantee from insurance coverage.
Results: Figure 4 shows the average per-acre profit under different conservation strip sizes. All values except for fully planted or fully retired are based on a weighted average of profit from corn production and the net CRP rental payment. Partial field retirement profits are also adjusted based on field edge effects (where relevant) and increased machinery transportation costs. The top line shows the estimated profit and cost without considering crop insurance. The lower two lines include net crop insurance premiums. The reason that the with insurance curves are lower than the without insurance curve is that the results only include premium costs and do not include any indemnities. For a single year, we cannot estimate an expected indemnity payment, as that is something that should only occur infrequently. However, with more years of data, we could adjust the with insurance curves based on an average indemnity payment. We want to highlight a few results that are of particular interest. First, we find that partial field retirement is more profitable than either fully planting corn or fully enrolling land into CRP. The average per-acre profit is $157.6 (all corn, no insurance), $119.4 (all corn, including insurance), or $134 (fully CRP). In contrast, the per-acre profit is maximized at $171.9 (no insurance), $151.6 (insurance with adjusted costs), and $147.3 (insurance without adjusted costs). The per-acre profit is $14.27 (9.06%) higher with partial land retirement than when planting the full field, and $37.86 (28.25%) higher than with full field retirement. Second, we find that the gain from partial field retirement is higher when crop insurance premiums are considered than when they are ignored. The increase in profit between the full planting outcome and partial-field retirement under no crop insurance is $14.27 per acre, while the increase is $32.21 or $27.95 with insurance, depending on whether insurance premiums are adjusted. Third, we find that the profit-maximizing level of strip retirement is slightly higher when insurance premiums are considered (11 strips) versus when they are ignored (10 strips) due to the additional benefits from premium cost savings.
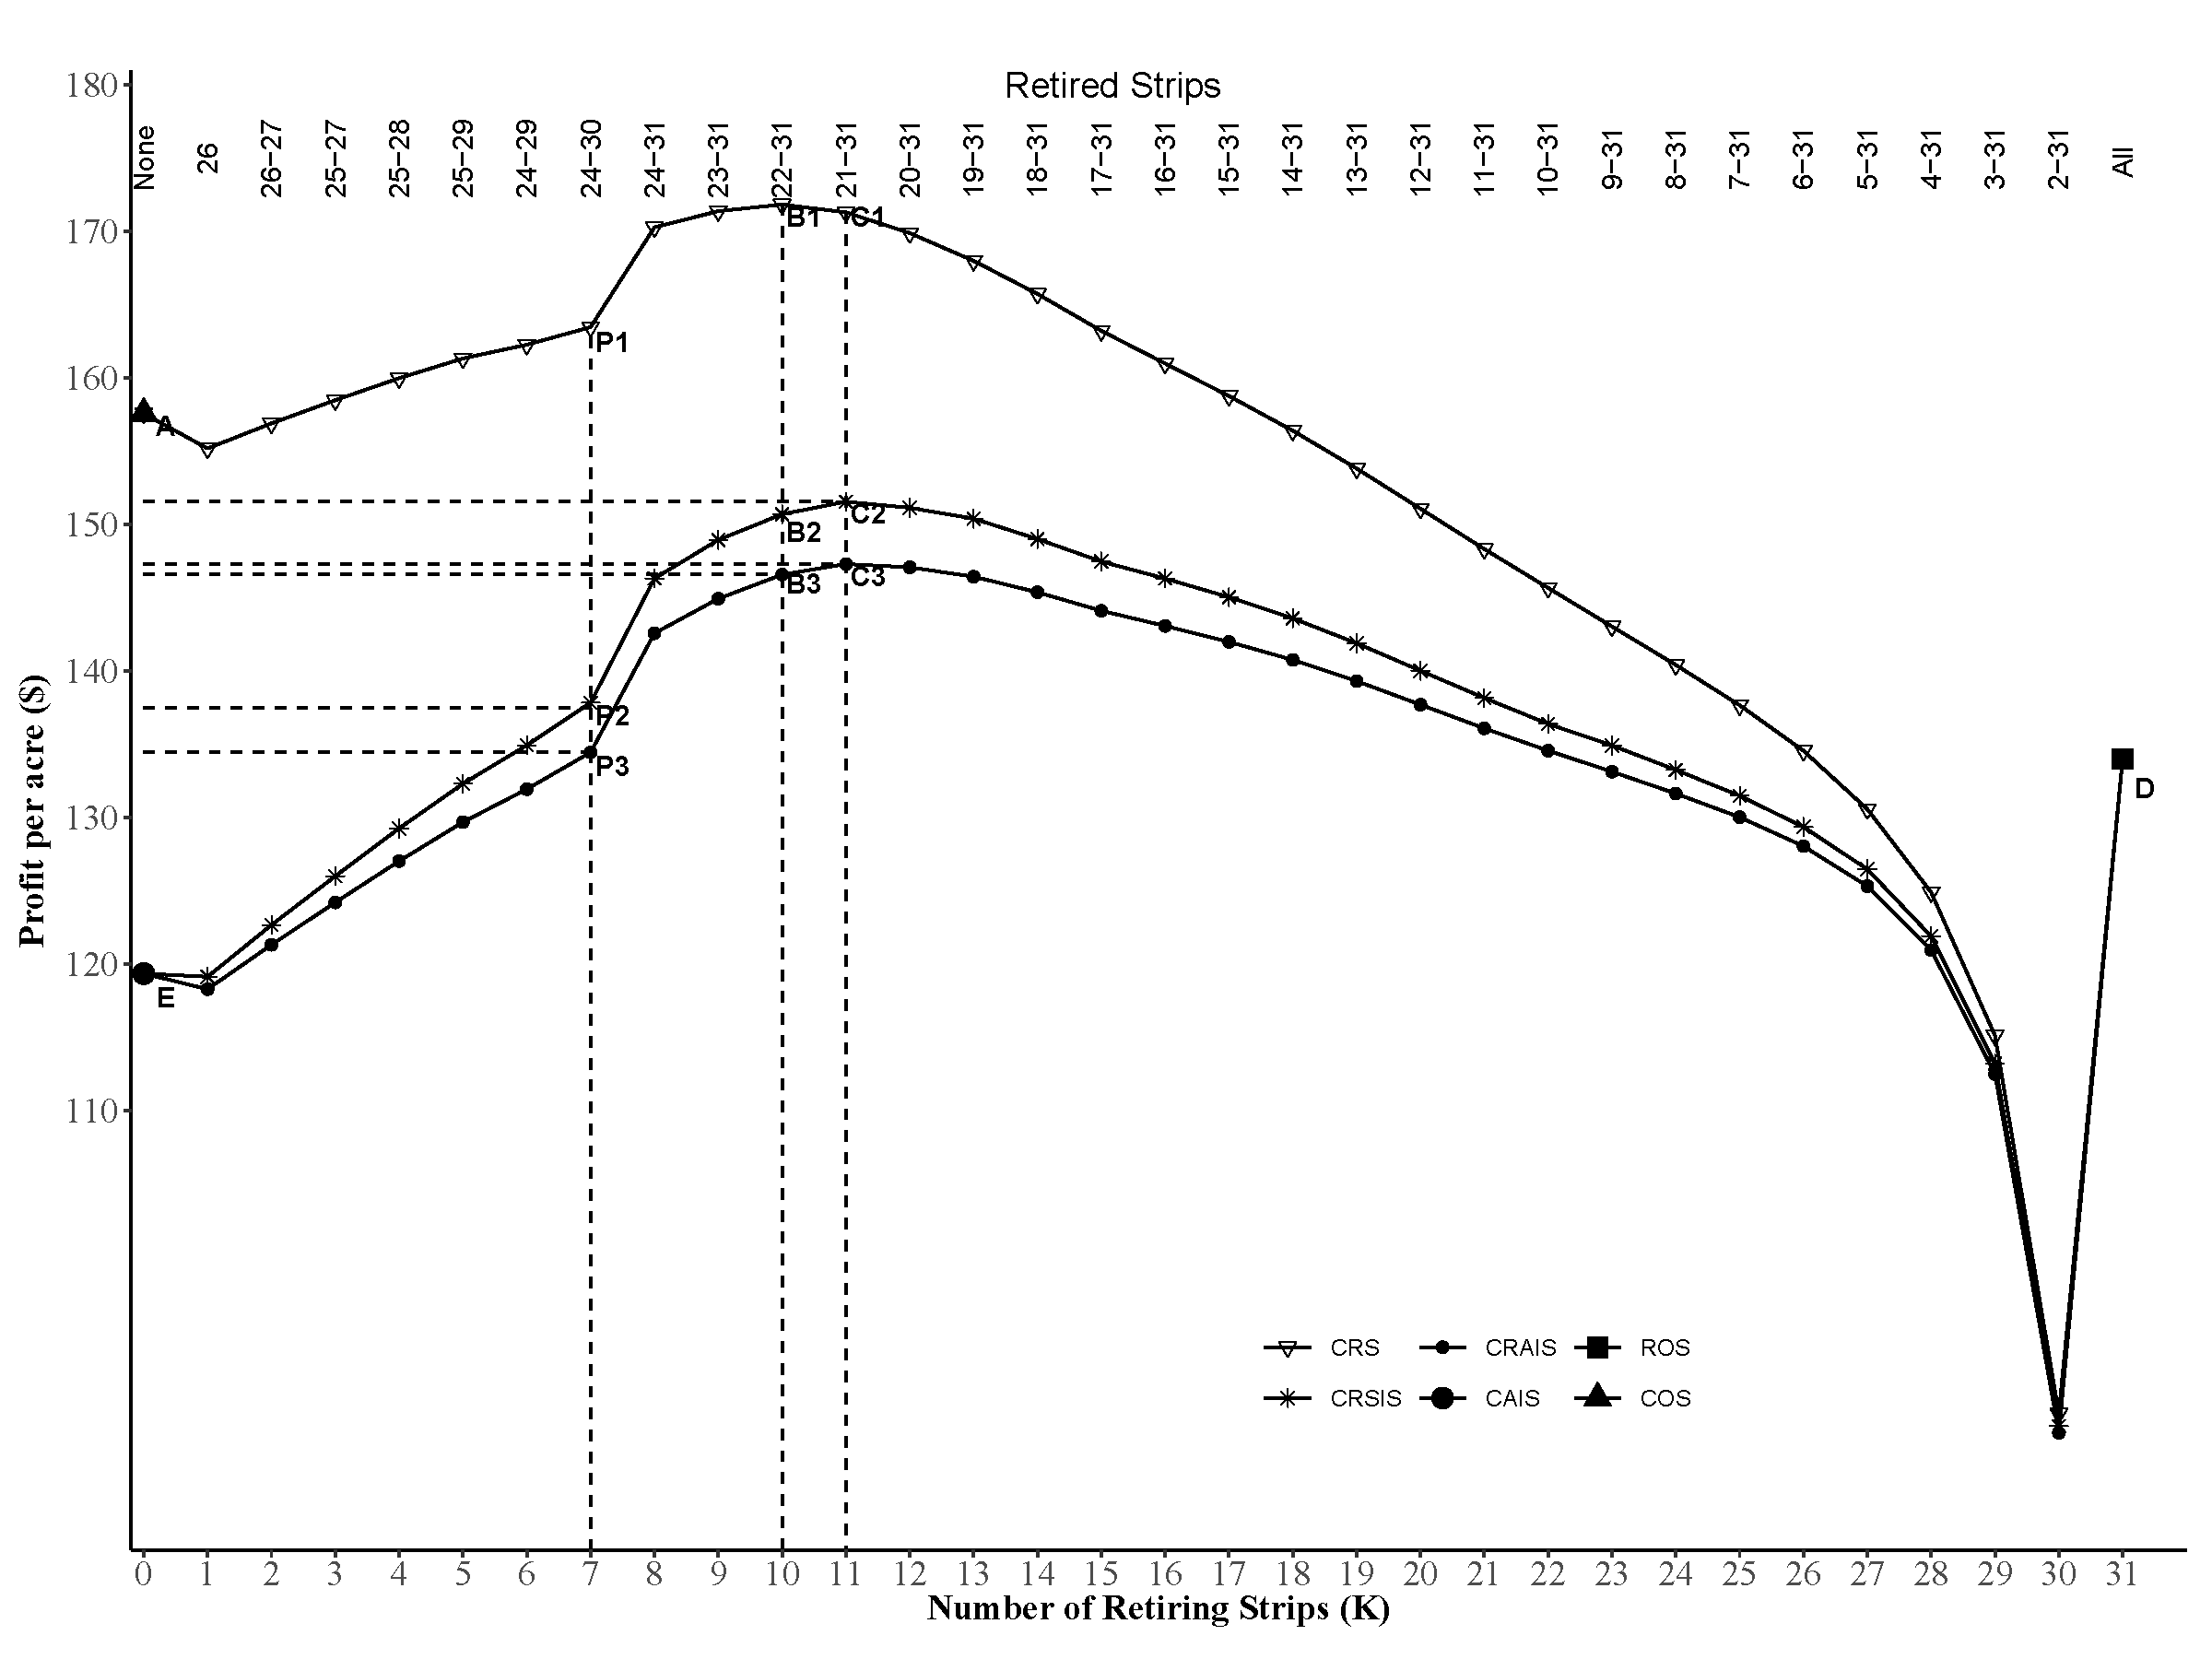
Figure 4: Average Per-Acre Profits under Varying Conservation Strip Sizes
In conclusion, using a novel dataset that includes within field variation in productivity, we find that partial field retirement for a prairie strip can not only provide conservation benefits, but can also be economically beneficial. We note that these results are for a single field with one year of data, and that additional years of production and fields are essential to determine how much these results can be generalized. We also note that precision systems can be costly, and a comparison of outcomes with and without this information is essential to determine if investing in such systems is profitable. However, variable rate system adoption is not rare, with 32% to 45% of farms (excluding small family farms with farm income less than $350,000) already adopting variable rate technogies (USDA, 2023). Thus, this analysis, using data and technologies that often already exist on a farm, shows that partial field land retirement can be both economically and environmentally beneficial, and that using the data from precision systems can improve the performance and placement of precision conservation.
Acknowledgments: We gratefully acknowledge funding from the National Institute of Food and Agriculture, Grant/Award Number: 2016-68004-24769; Natural Resources Conservation Service, Grant/Award Number: NR213A7500013G021; and USDA NIFA's Hatch Project 470-362.
Author information:
Karina Schoengold
Professor
Department of Agricultural Economics
Associate Director, Nebraska Water Center
University of Nebraska-Lincoln
kschoengold2@unl.edu
Badri Khanal
Delaware Department of Finance
Taro Mieno
Associate Professor
Department of Agricultural Economics
University of Nebraska-Lincoln
tmieno2@unl.edu
David Bullock
Agricultural and Consumer Economics
University of Illinois
References:
Khanal, B., Schoengold, K., Mieno, T., & Schulte Moore, L. (2022). The impact of policy design on willingness to pay for ecosystem services from prairie strips. Journal of the Agricultural and Applied Economics Association, 1(3), 352-369. https://doi.org/10.1016/j.scitotenv.2025.179315
Khanal, B., Mieno, T., Schoengold, K., & Bullock, D. S. (2025). Optimizing precision conservation with on-farm precision experiment data: The role of crop insurance and spatially variable profit. Science of The Total Environment, 979, 179315. https://doi.org/10.1016/j.scitotenv.2025.179315
Schnitkey, G., Swanson, K., (2019). Release of 2020 Crop Budgets, Revised 2019 Budgets, and Up-dated Revenues and Costs. farm-doc daily. URL: https://farmdocdaily.illinois.edu/2019/07/release-of-2020-crop-budgets-revised-2019-budgets-and-up-dated-revenues-and-costs.html
Schulte, L. A., Niemi, J., Helmers, M. J., Liebman, M., Arbuckle, J. G., James, D. E., ... & Witte, C. (2017). Prairie strips improve biodiversity and the delivery of multiple ecosystem services from corn–soybean croplands. Proceedings of the National Academy of Sciences, 114(42), 11247-11252. https://doi.org/10.1073/pnas.1620229114
Tyndall, J.C., Schulte, L.A., Liebman, M., Helmers, M., 2013. Field-level financial assessment of contour prairie strips for enhancement of environmental quality. Environ. Manag. 52, 736–747. https://doi.org/10.1007/s00267-013-0106-9
USDA (2023), Economic Research Service (ERS) using USDA, National Agricultural Statistics Service and ERS 2023 Agricultural Resource Management Survey (ARMS) data. Available at: https://ers.usda.gov/sites/default/files/_laserfiche/Charts/110551/Precision-Ag.png?v=87963