
Content
October 22, 2025
What is carbon intensity (CI), and how does it relate to agriculture?
Carbon Intensity (CI) is a measure of greenhouse gas emissions (GHG) footprint, often measured in units of carbon dioxide equivalent (CO2e) emitted per unit of output, over the life-cycle of production. GHGs have been of growing concern over recent decades because of their impact on global warming. Agriculture accounts for about 10% of human-caused GHGs in the U.S., while transportation accounts for about 28%.
One U.S. policy response to global warming was the 2006-2007 establishment of the Renewable Fuels Standard (RFS), which identified certain ethanol and other renewable fuels as having lower carbon emissions than gasoline. It propelled the corn ethanol industry by establishing mandates and subsidies for using fuels from corn, soybeans, and other agricultural feedstocks.
This approach to reducing GHGs is now being upended by the provisions of the Inflation Reduction Act of 2022 (the IRA,), as modified somewhat by the One Big Beautiful Bill Act of 2025. Among other things, the new legislation establishes tax credits for the production of low-carbon fuels, now to be based on their CI relative to gasoline, rather than based on the feedstock and processing methods used as did the RFS.
The IRA measures fuel CI as grams of CO2e emitted (over the "life-cycle" of fuel production) per megajoule of energy in the fuel. In the case of biofuels, the carbon intensity of the feedstock (such as pounds of CO2e emitted per pound of corn produced) is an important contributor to fuel CI, and it is anticipated (though not required) that biofuel producers may provide incentives for low CI corn and soybeans.
The rules for implementing the IRA provisions for transportation fuels are still being developed, so it is not yet clear when incentives for low-CI crops might be available, nor how much they will be. But corn and soybean producers can prepare for that day by beginning now to identify and reduce the CI of their crops.
Corn and soybeans are, of course, not only used in biofuel production, but they are also fed to livestock, and Nebraska livestock producers are also beginning to be concerned about establishing the "sustainability" of their products. It seems likely that at some point in the future, livestock producers may also be willing to pay grain producers a premium for low-CI grain.
How is CI measured?
Here, we measure crop CI in terms of the amount of CO2e emitted per lifecycle of unit produced. Lifecycle emissions include not only emissions from the field, but also emissions traced back to the production of fertilizer, fuels, and other inputs used[1]. It is not possible to directly measure all these emissions as they occur, but "emissions factors" (these, too, are carbon intensities) have been developed for various inputs and processes, and "life-cycle assessment" (LCAs) models are generally employed to keep track of science-based estimates of emissions due to particular inputs and processes. One such LCA is GREET FD-CIC (which is indicated for use in the IRA bill), established and maintained by the Department of Energy. Another is IFSM, maintained by the U.S. Department of Agriculture[2]. IFSM simulates the growth of the crop given daily weather during the season, while GREET relies more on "inventories" of inputs and processes used and requires the user to specify yield.
Each of these models can be employed by individual farmers or other interested parties to obtain estimates of CI for specific production situations. We employed both models to estimate CIs that users might be expected to obtain for corn and soybean production in Nebraska. At the present time, there is no standard approved method for determining CI, and there will not be until such details are specified by the Treasury Department (or perhaps other entities) in order to qualify for low-CI incentive payments.
Estimates of CI of Nebraska-produced corn and soybeans
For reference, GREET estimates the US-wide default value for corn CI at 0.297 pounds of CO2e per pound of corn dry matter produced, and that for soybeans at 0.338[3]. Here, we use both GREET and IFSM to estimate the CI that LCA model users are likely to obtain for corn and soybeans produced with and without irrigation in three regions of Nebraska. In this section, neither model considered emissions changes due to changes in soil organic carbon (SOC). We address this issue in the next section on the effect of climate-smart practices on crop CI.
Crop CI differs by region and production practice
Crop CI is affected by weather, fertilizer and fuel used, yields and soil type, so we are interested here in the average, or expected, value that might be obtained by LCA users. We divided the state into three regions to group counties by similar weather and ecology: West, Central, and East Nebraska (denoted by color in Figure 1). In Table 1, we report some characteristics of corn and soybean production in each region.
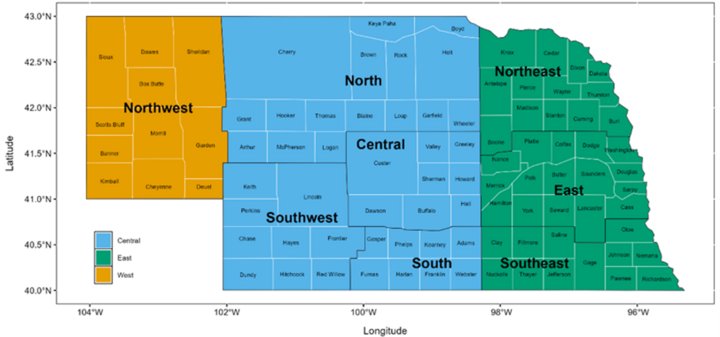
Figure 1. Nebraska regions considered in this study.
Table 1. Data from regions of Nebraska defined for this study (NASS data)*
East Nebraska | Central Nebraska | West Nebraska | |
| Average irrig. corn acres, 2016-18 | 2,486,667 | 1,942,875 | 310,167 |
| Average non-irrig. corn acres. 2016-18 | 2,783,000 | 799,775 | 146,633 |
| Average yield, irrig. corn, 2016-18 (bu/acre) | 208 | 212 | 181 |
| Average yield, non-irrig. corn, 2016-18 (bu/acre) | 168 | 124 | 71 |
| Average irrig. soybean acres, 2016-18 | 1,589,500 | 918,800** | 2,033^ |
| Average non-irrig. soybean acres. 2016-18 | 2,519,667 | 253,900** | - |
| Average yield, irrig. soybeans, 2016-18 (bu/acre) | 65 | 67** | 43^ |
| Average yield, non-irrig. soybeans, 2016-18 (bu/acre) | 53 | 48** | - |
Note:*Data are reported for 2016-18 because NASS stopped reporting data separately for irrigated and rainfed production after 2018 **The average does not account for the Southwest region for which data was unavailable; ^average for 2007-09. | |||
Expected CIs for Nebraska corn and soybeans
Every farm field is to some extent unique, so the estimated CI is also unique for a particular crop, production practices, location, and year. Here, we calculate CIs for the representative situations in Table 2 to obtain average expectations of crop CIs. To achieve this, we calibrated each of the LCA models to match production information under reduced tillage at one county and weather station in each region (weather stations for IFSM were Alliance in West, North Platte in Central, and Norfolk in East), with no soil organic carbon (SOC) changes considered in either model. The CI estimates from the IFSM and GREET models are reported in Table 2.
Table 2. Expected IFSM and GREET FD-CIC results* for CI for Nebraska corn and soybeans under standard production practices, no SOC included
Corn | Soybeans | ||||
| Region | IFSM | GREET | IFSM | GREET | |
----------lb CO2e/lb of grain DM---------- | |||||
| East | |||||
| Rainfed | 0.320 | 0.256 | 0.310 | 0.329 | |
| Irrigated | 0.280 | 0.242 | 0.270 | 0.307 | |
| Central | |||||
| Rainfed | 0.280 | 0.311 | 0.300 | 0.418 | |
| Irrigated | 0.270 | 0.245 | 0.250 | 0.307 | |
| West | |||||
| Rainfed | 0.370 | 0.335 | - | - | |
| Irrigated | 0.280 | 0.252 | 0.340 | 0.329 | |
| Nebraska averages** |
| ||||
| Rainfed | 0.314 | 0.267 | 0.309 | 0.336 | |
| Irrigated | 0.276 | 0.244 | 0.263 | 0.307 | |
| weighted avg. | 0.290 | 0.252 | 0.284 | 0.321 | |
* IFSM entries are the averages of CIs recorded using individual weather years from 2014 to 2023. GREET entries used average of 2014-2023 yields. **Share weighted averages using shares from recent NASS production. | |||||
For corn, the expected CI for Nebraska under standard reduced tillage production practices ranges from 0.27 to 0.37 using IFSM, from 0.242 to 0.335 using GREET. We have found other published estimates of corn CI relevant to Nebraska that range from 0.07 to 0.73, compared to the GREET default for the US of 0.297. Average irrigated corn CI in Nebraska is about 10% lower than that for rainfed production. The results we obtained fall well within the range of other published estimates. On average, corn produced in Nebraska has a carbon footprint similar to the national average.
The expected CI for Nebraska soybeans ranges from 0.25 to 0.34 using IFSM, or 0.307 to 0.418 using GREET, compared to the GREET US average of 0.338. As is the case for corn, the average CI of irrigated soybeans is roughly 10% lower than for rainfed soybeans
Climate-smart agriculture and crop CI
In the above analysis, the LCA models ignored changes in emissions due to changes in soil organic carbon. Here we report how CIs as estimated by LCA models change when crops are produced using three practices in the category of "climate-smart agriculture" that are expected to increase soil organic carbon: reduced tillage, no-till, and cover crops. Each of these practices reduces the crop CI score by increasing carbon sequestered in the soil, thus offsetting some or all of the carbon emissions presented in Table 2, where changes in soil carbon were ignored. Both the GREET model and a recently-released USDA FD-CIC model are able to calculate estimated CI when these practices are adopted; IFSM does not. (We repeat here that in our results above, we used the models to estimate CI under reduced tillage, ignoring any changes in soil carbon.) We summarize in Table 3 the change in corn CI results when we used these models to examine their predictions of the effect of adopting climate-smart practices.
Table 3. Change in model predictions of Nebraska corn CI with climate-smart practices adopted, compared to base results presented in Table 2.
Tillage | Cover crop, with: | ||||||
| Model | County | conv. | reduced till | no-till | conv. till | reduced till | no-till |
| GREET FD-CIC | Madison (East) | 11% | 0% | -13% | -47% | -78% | -98% |
| Lincoln (Central) | 15% | 0% | -18% | -73% | -89% | -116% | |
| USDA FD-CIC | Madison (East) | 6% | 0% | -23% | -22% | -29% | -55% |
| Lincoln (Central) | 8% | 0% | -12% | -6% | -25% | -29% | |
| Box Butte (West) | 8% | 0% | -7% | -16% | -26% | -34% | |
The GREET model estimates that corn CI in East and Central can be reduced to around zero if both cover crop and no-till are adopted. The USDA FD-CIC model estimates less dramatic reductions. We cannot, at this point, explain why the results from the two models are so different, but they do reflect that science has not yet settled on the likely impacts of these practices.
Table 4 shows the comparable changes for soybean CI with cover crops and alternative tillage levels. Both alternate tillage and cover crops reduce soybean CIs even more than corn CIs. Again, the USDA FD-CIC model predicts a smaller impact than the GREET model.
Table 4. Change in model predictions of estimated soybeans CI with climate-smart practices adopted, compared to base results presented in Table 2.
Tillage | Cover crop, with: | ||||||
| Model | County | conv. | reduced till | no-till | conv. till | reduced till | no-till |
| GREET FD-CIC | Madison (East) | 21% | 0% | -27% | -89% | -104% | -146% |
| Lincoln (Central) | 40% | 0% | -37% | -49% | -97% | -134% | |
| USDA FD-CIC | Madison (East) | 8% | 0% | -32% | -48% | -57% | -96% |
| Lincoln (Central) | 13% | 0% | -24% | -15% | -30% | -58% | |
| Box Butte (West) | 8% | 0% | -2% | -58% | -66% | -73% | |
Summary
The results reported above are our preliminary evaluations[4] of expected CIs that might be obtained using standard LCA models for corn and soybeans produced in Nebraska. The expected CIs for corn calculated using IFSM are about 20% higher than using GREET. For soybeans, we found the opposite: the IFSM estimates were about 10% lower than those using GREET. We have no objective way to determine which model is most accurate, though GREET has been more widely used for regulatory purposes. When and if market premiums are offered for low CI grain, the agency offering the premium will specify the methods to be used for qualification. Meanwhile, producers and others might use either model as they begin to establish the CI of their grain.
Expected average Nebraska corn Cis, as we have calculated them, average about 0.290 (using the IFSM model) or 0.252 (using GREET model), compared to a U.S. default value of 0.297. Expected Nebraska soybean CIs average about 0.284 (IFSM) or 0.321 (GREET), compared to a U.S. default value of 0.338. These results suggest that Nebraska crop CIs for many Nebraska producers will be below the national average under reduced tillage with standard production practices.
The possibility of future premiums for low CI crops provides potential value for reducing tillage and adding cover crops for Nebraska producers. Reducing tillage alone can reduce estimated corn CI by 20-40%, and when combined with a cover crop, can reduce corn CI by 70-100+%. These practices can reduce soybean CI by even more.
References
GREET. We employed GREET Feedstock CI Calculator 2023 - Dynamic version, downloaded from www.energy.gov/eere/greet in February 2025.
IFSM. We employed IFSM version 4.8, downloaded from: https://www.ars.usda.gov/northeast-area/up-pa/pswmru/docs/integrated-farm-system-model/ in October 2023.
USDA FD-CIC. We employed the preliminary USDA Feedstock Carbon Intensity Calculator, downloaded from https://www.usda.gov/usda-fdcic in January 2025.
Perrin, R., F. Almeida, L. Fulginiti, and E. Dennis (2025). Expected carbon intensity (CI) for Northern Plains corn and soybeans. Department of Agricultural Economics Faculty Publications Series, UNL digital commons.
Richard K. Perrin
Jim Roberts Professor
Department of Agricultural Economics
University of Nebraska-Lincoln
rperrin@unl.edu
Felipe Miranda de Souza Almeida
Graduate Research Assistant
Department of Agricultural Economics
University of Nebraska-Lincoln
falmeida2@huskers.unl.edu
Lilyan E. Fulginiti
Roy Frederick Professor
Department of Agricultural Economics
University of Nebraska-Lincoln
lfulginiti@unl.edu
Elliott Dennis
Associate Professor
Department of Agricultural Economics
University of Nebraska – Lincoln
elliott.dennis@unl.edu
[1] We have encountered measures of corn CI as g of CO2e per MJ, but this is relevant only for corn (or soybeans) that are converted to biofuel. In the case of corn, we multiply CI as g of CO2e per MJ times 0.0108 to obtain lb CO2e per lb grain DM.
[2] We use IFSM (Integrated Farm Simulation Model) because its capacity to estimate CI for livestock as well as crop production makes it suitable for our overall project that examines the potential for sustainable beef.
[3] GREET FD-CIC reports crop CI in grams of GHG per bushel. We convert this to pounds of GHG per pound of dry matter of crop to make it comparable with IFSM values.
[4] These results have not yet received peer review.