
Content
Farm managers are destined to face a myriad of choices while looking for and seeking the right balance between methods and outcomes that satisfy their individual farm’s needs. Successful farms require productivity, profitability, and continuity. This holds true for the many production choices made throughout the year. One of these opportunities is the purchase of electricity for irrigation. Nebraska is a unique state in that its electric power is generated and delivered by public power companies. The largest single entity in that system is NPPD, which serves all or part of 84 of the 93 counties within the state. NPPD has developed four optional programs to purchase irrigation electricity. These have been developed due to the ever-increasing demand for electrical power across the state. The summer season’s need for cooling and irrigation makes this time of year one where electricity demand is at its highest. The need to supply adequate, affordable electricity is one of the long-run challenges utilities face as they strive to fill and maintain their role as power suppliers. For this reason, NPPD continues to work at adding capacity and increasing efficiency, as noted by some of the projects described in this link: https://www.nppd.com/powering-nebraska/projects. NPPD’s four programs focus on incentivizing off-peak power use. This is accomplished by adjusting costs per kilowatt hour and/or limiting electrical usage during key time periods. This paper discusses these four optional producer programs (PPs) offered to farmers who use electricity for irrigation.
There is no such thing as a standard irrigation system, nor a standard method of using that system to irrigate, resulting in a wide variation of customer applications and needs. It is also true that the PPs chosen are affected by the crop type, system capacity, management and skill of the operator, soil type, topography, and other relevant factors. Having said that, there are some basic and common factors among systems that make it worthwhile to discuss the four PPs.
NPPD’s irrigation season begins June 1 and ends by September 30th of each year. The following information is taken from various web sources published by NPPD https://www.nppd.com/accounts-billing/your-rates/irrigation-rates. The simplest and likely the most common method of acquiring power is to pay a flat standard rate, or what is identified as a No Control (NC) regime https://www.nppd.com/rates/no-control. The NC, as the name suggests, is a single rate per kilowatt hour (kWh) of electricity for all units used. A kWh is measured as one thousand watts of power used over one hour, e.g., ten one-hundred-watt bulbs electrified for an hour. The current 2025 NC rate is $0.1046/kWh. As an annually incurred electrical service, the cost of power is accompanied by an annual fee of $48.25/kilowatt (kW) based on the individual system’s capacity and defined by NPPD. For instance, the annual enrollment fee for the NC option for a 10-kW irrigation system is $482.50, while a 20-kW rated system would be twice that amount. The second pricing option offered by NPPD is called Time-Of-Use, or TOU program. The annual service fee is slightly less than the NC option and is $44.75/kW. The charge for the power per kWh comes according to three designated periods of time within the weekday. Electricity used during the so-named peak period, highest use, 2 pm to 6 pm weekdays, has the greatest cost at $0.2996/kWh. The mid-peak period, used from 10 am to 2 pm and 6 pm to 10 pm weekdays, is about half the cost and is charged at $0.1448/kWh. These rates are not applied to weekends, 4th of July, Labor Day, and all other times and have a single off-peak value of $0.0597/kWh. This price is the least expensive charge per kWh among the four programs https://www.nppd.com/rates/time-of-use. This rock-bottom price is even lower than the off-season winter price of $0.0765/kWh. The remaining two control programs are similar to each other. They both involve direct control or power shutoffs. When the power company projects a need to purchase peak power on the open market, it declares a control day. During this, they may or may not turn power off (control) eligible producers, depending on the observed level of needed power of the various users. Historically, for the past 16 seasons, about 54% of the announced control days resulted in actual control action. In the case of Two-Day Control (TDC), a producer is only eligible if the control day occurs on one of their two selected weekdays. As for the other control program, Anytime Control (ATC), all enrollees are eligible to be controlled when it is necessary. The TDC plan requires the customer to specify which two days during the work week they want as eligible control days (Monday through Friday). If and when a control announcement occurs and it happens to be on one of their specified days, the TDC customers are eligible to be controlled and may be shut down for as many as five consecutive hours during the 10 am to 10 pm time frame. The one-time annual fee for TDC is $42/kW with a flat fee of $0.0949/kWh. This is nearly one cent per kW less than the NC plan. The ATC program is very similar to TDC except that control days are not limited by the customer's choice but are at the behest of the power company and may occur on any weekday. Again, the maximum number of hours per day of control is limited to five consecutive hours between 10 am and 10 pm. This program has the lowest bundled annual startup fee of $38.75/kW capacity and $0.0609/kWh for all hours of use https://cdn.prod.website-files.com/5a26c42ac0c9b0000147937c/6776b45200f745448e7272ed_InterruptibleIrrigationService.pdf.
These four options have differing implications for both irrigation costs and possible effects on productivity depending on the frequency of control, capability of the irrigation system, soil type, natural rainfall, and the irrigation/water management plan. Unfortunately, there is not enough space in this article for an analysis of these programs. However, the tools needed to make these analyses, and their quantification, are currently being developed and applied. Once complete, that work will be reported. Therefore, the discussion here will be limited to an encapsulation of historical information and serve as an introduction to the context related to making the choice among the four options and, of course, as a teaser for the coming detailed report.
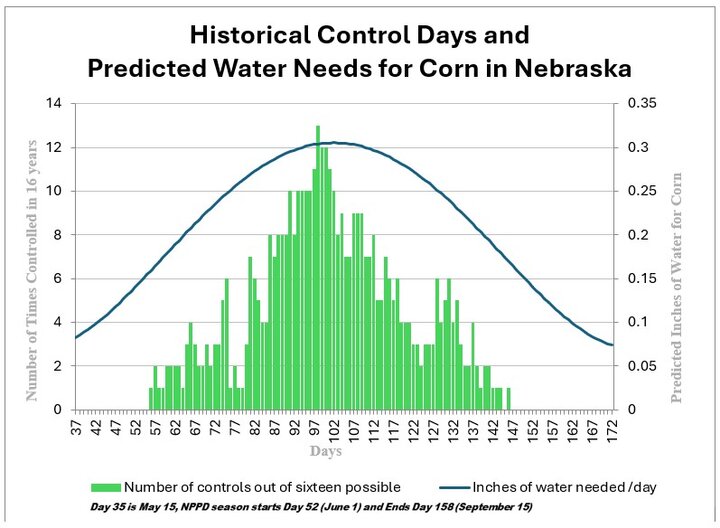
The first key idea to consider when understanding the effect of the four options is the relationship between water needs of a growing crop over the time-period of the irrigation season. The graphic in Figure 1 is illustrative of corn grown in Nebraska and the amount of water needed to keep it fully supplied or irrigated.
Figure 1. A representation of Nebraska corn plants water use in acre inches per day

The smooth symmetrical line in Figure 1 is an estimated relationship developed from the raw data shown as the jagged line in the same figure. The jagged line indicates the reality of the intermittence of water use, while the smooth line is an average use over the life span of the crop during its various stages of growth and productivity. From this figure, it is obvious that the corn plant uses an increasing amount of water after emergence (approximately day 35) on the graph. This increases as the season progresses to about day 107 while the plant is actively growing. The use slowly decreases as the plant develops ears/kernels, which eventually fill, and then finally it begins dying (senescence), requiring less and less water until blackline and plant death. This process is generally measured as ET (the evapotranspiration rate). This cycle matches well with summer light and heat patterns, which stimulate growth and productivity. The increased water needs of the plants require more intensive irrigation, which drives increased use of electricity, coinciding with the increased need to cool homes and businesses and other summer demands, making the highest control days occur during the highest need for irrigation. This relationship is clearly illustrated in Figure 2.
Figure 2. Comparison of corn plant water needs and the number of control days by NPPD for the years 2009 to 2024
Using the historical period of 2009 to 2024, NPPD-controlled irrigation events, CEs, occurred 239 days out of 1,712 days of the irrigation season. Each of the sixteen seasons had approximately 107 days, during which CEs were limited to occur between June 1 to September 15. Further details from Table 1 show that the weeks from the 6th of July to the week of August 3rd accounted for nearly 76% of all CEs. The week of July 29th had by far the most CEs, with just slightly more than 20%. The weeks beginning June 1, August 31, and September 7 had no CEs.
Table 1. Average number of irrigation events controlled (CEs) by NPPD by week, identified by day and month for the years 2009 to 2024
Week | Number by Week | Percent by Week |
1-Jun | 0 | 0.0% |
8-Jun | 2 | 0.8% |
15-Jun | 5 | 2.1% |
22-Jun | 10 | 4.2% |
29-Jun | 15 | 6.3% |
6-Jul | 37 | 15.5% |
13-Jul | 42 | 17.6% |
20-Jul | 47 | 19.7% |
27-Jul | 30 | 12.6% |
3-Aug | 25 | 10.5% |
10-Aug | 6 | 2.5% |
17-Aug | 12 | 5.0% |
24-Aug | 8 | 3.3% |
31-Aug | 0 | 0.0% |
7-Sep | 0 | 0.0% |
| 239 | 100% |
It is important to identify two distinct periods of control, P1, 2009 to 2017, and P2, 2017 to 2024. These periods differ due to policy changes that affect both the duration and frequency of CEs. During P1, there were 317 possible CEs with 173 realized CEs, resulting in an average of 35.2 CEs per season. The more recent P2 time period had 128 CEs announced, with 66 actual controls giving an average of 18.3 per season. The P2 period control length per day is 5 hours maximum. The prior control period, P1, had a maximum of 10 control hours per CEs. Both the frequency and length of the CEs have nearly halved. Armed with an understanding of the four options provides a basis to make a more informed choice on the program that best suits the needs of an operation. For instance, a field that has low water holding capacity (sandy soil) and limited irrigation capacity would likely favor the NC system due to the effect of the high frequency and longer duration of irrigation required to satisfy the needs of the crop. A soil type with good water holding and permeability, coupled with a high-capacity irrigation system, might benefit from the ATC or TOU options, as well as fields that are smaller and take less time to cover. In this last case, the system could run for shorter durations while supplying the needs of the crop. Depending on one’s tolerance for risk, the TDC might also be viable. In the future, it is expected that electricity generation will need to increase and that the cost will rise. Utilities such as NPPD will continue to search for and implement programs that will foster power availability and affordability. It is for this reason that it is important that the follow-up research mentioned in this text be completed and reported.
Matt Stockton
Professor
Department of Agricultural Economics
University of Nebraska-Lincoln
West Central Research and Extension Center
mstockton2@unl.edu