
Content
May 20, 2026
If you give a country a free trade agreement, they might export commodities to you. If they export commodities to you, you might replace some of your domestic production with their imports. If you decrease your domestic production while importing more, you might have a trade deficit.
The United States is the world’s largest agricultural exporter, but its agricultural trade balance has shifted over time and is now in deficit. The rate of agricultural exports has grown slowly over the last 10 years (1 percent annually) due to global competition, a strong dollar, and trade barriers, while imports have grown at a faster rate (6 percent annually). The increase in U.S. agricultural imports has come mainly from free trade agreement (FTA) partners, where negotiated reductions in barriers to trade have increased market access. Much of the increase in imports has come from consumer-oriented products, such as fruits and vegetables.
We use tomatoes as an example of a vegetable where imports have increased, and U.S. domestic production has decreased. As shown in Table 1, U.S. domestic tomato production in 2025 was 12.6 million metric tons (mmt)—down from 14.4 mmt in 2016. The 2025 amount is a rebound from a low of 11.5 mmt in 2022. Guan et al. (2017) noted that U.S. tomato production decreased by 48 percent from 2002 to 2015; the amounts shown in Table 1 are further decreases from that. Table 1 includes a column for tomatoes grown “under protection” which is any kind of structure that provides shelter (e.g., a greenhouse); however, this amount is very small compared to open field production. These numbers come from a survey which is conducted every 5 years; hence most years are not available (NA). This category is important when we talk about imports.
The percentage decrease in U.S. domestic open field production from 2016-2025 was 12.54 percent, which is almost perfectly matched with the increase in tomato imports (13.62 percent). All three time periods of tomato imports (they are categorized by importing Harmonized System (HS) code in the data) had an increase in their imports over time, but the increase was led by the 38.99 percent increase in tomato imports from July 15 to August 31. Where do U.S. tomato imports come from? In 2025, 88.34 percent came from Mexico, 10.84 percent came from Canada, and a small amount came from Central American countries, Australia, New Zealand, Portugal, and Spain. Imports from Canada, in particular, have increased over time—in 2016, imports were 154,273 metric tons (mt), and by 2025, this increased to 220,105 mt.
Table 1. U.S. domestic tomato production and imports, million metric tons

Source: Production data is from NASS (2026), and import data is from FAS (2026)
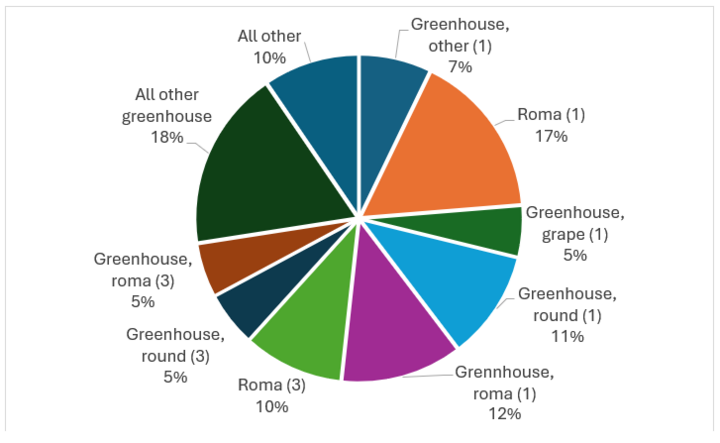
How are Canada and Mexico able to export so many tomatoes to the U.S.? A main reason is that these two countries use greenhouses for much of their production that is exported to the U.S. Figure 1 breaks down U.S. tomato imports by type and time period. Most U.S. tomato imports are from greenhouse-grown varieties (63.95 percent). In fact, almost all of Canada’s tomato exports to the U.S. are grown in greenhouses (95.22 percent). The majority of Mexico’s tomatoes exported to the U.S. are grown in greenhouses (60.70 percent).
Figure 1. Composition of U.S. tomato imports by type and time period
Source: FAS (2026)
Note: (1) refers to the 3/1-7/14 or 9/1-11/14 time period, and (3) refers to the 11/15-2/28 time period. Most of the greenhouse imports in the all other greenhouse category are from the (2) 7/15-8/31 time period.
The use of greenhouses, especially for exporting tomatoes (as well as cucumbers, mushrooms, and peppers), has been well documented. Agriculture and Agri-Food Canada (2025) notes that Canada’s greenhouse industry is primarily clustered near the U.S. border to be close to large consumer markets. They note that there were 974 commercial greenhouse vegetable operations in Canada in 2024, with 72 percent of the production located in Ontario. Research from Cook and Calvin (2005), Francis (1998), and Purdy (2005) documented the rapid rise in Canada’s greenhouse production after the North American Free Trade Agreement (NAFTA). Tomatoes in Mexico were largely grown in open fields pre-NAFTA, but Mandujano (2025) notes that now 70 percent of Mexico’s production takes place in greenhouses. As indicated in data from Table 1, the share of U.S. tomatoes grown in greenhouses (under protection) is very small; hence, the U.S. relies on domestic production from California or Florida (which could be seasonal) or greenhouse-grown tomatoes from their NAFTA partners.
Tomatoes are an example of a consumer-oriented product that has seen an increase in imports. Although the United States is the world’s largest agricultural exporter by both value and quantity, most U.S. agricultural export quantities are in the bulk commodity category. Bulk commodities typically receive a lower unit price than intermediate and consumer-oriented goods, as there is little to no value-added (that is, any step in the processing of a commodity uses labor/capital) associated with these commodities. In 2025, 69.0 percent of U.S. export quantities came from bulk commodities, representing 29.7 percent of the total value of U.S. exports. Further, Table 2 indicates that US bulk commodity exports sold for an average of $329.8/mt in 2025, relative to $777.7/mt for intermediates and $3,387.3/mt for consumer-oriented commodities. The unit price of bulk and intermediates fell in 2025 compared to previous years, while consumer-oriented commodity prices increased.
Table 2 also provides data on U.S. imports across the bulk, intermediate, and consumer-oriented categories. In 2025 (and all years in the table), the United States exported more bulk and intermediate commodities than it imported, but the price paid on imports was higher due to the varying types of intermediate commodities exported versus those that were imported. As such, the total value of intermediate imports exceeded that of exports. As an example of commodities in these classifications, the largest intermediate commodity exported by the U.S. is soybean meal. In 2025, the unit value of soybean meal exports was $359.7/mt, on the other hand, vegetable oils (the intermediate commodity imported the most) had a unit value of $1,834.0/mt. Table 2 indicates that the consumer-oriented products that the United States exports have a higher unit value than those they import, but they import almost double the quantity of what they export.
Table 2. U.S. export and import values and quantities

Source: FAS (2026)
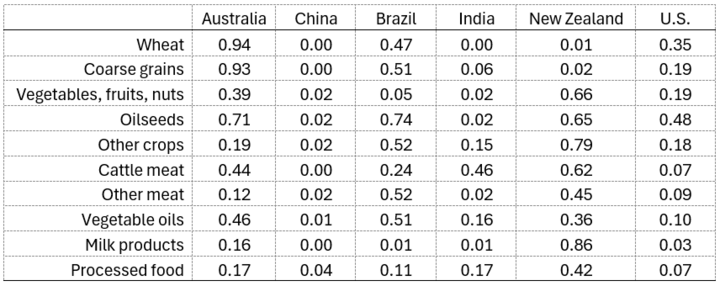
So why has the U.S. turned from having an agricultural trade surplus to a deficit? As Table 2 indicates, imports have been growing faster than exports, and the commodities imported cost more on a unit basis. Some of this is because the U.S. has smaller tariffs than most other countries, and the United States also often faces tariff-rate quotas and non-tariff barriers that prohibit trade of some products (mainly meats). Another reason for the deficit is the reliance on bulk exports. Table 3 shows countries' export share of production for some agricultural commodities. We include China and India to show that more populous countries tend to export less, since they consume the food domestically. Australia and New Zealand are synonymous with pursuing FTAs to gain market access; hence, they have high export shares across many of the commodities. Brazil also has an export share of more than 50 percent for coarse grains, oilseeds, other crops, other meat, and vegetable oils. The United States does not have an export share of production greater than 50 percent for any of the commodities. Hence, the U.S. seems to be more characterized by the major populated countries of China and India. In terms of imports, the United States gets many of its consumer-oriented commodities from FTA partners, such as the example for tomatoes. Many of the fruits and vegetables the U.S. imports now happen year-round—such as blueberries and grapes from Chile and Peru, or tomatoes from Canada and Mexico, whereas imports used to be more seasonal. Note that in 2025, the value of U.S. imports from FTA partners was $120 billion, while the value of exports to this group was $89 billion. Some of these imports have led to a decrease in domestic production (such as tomatoes), which could leave less product available to export.
Table 3. Export share of production
Source: Aguiar et al. (2025)
Does this mean that free trade agreements are bad for U.S. agricultural trade? Of course, not. The example of tomatoes highlights that U.S. consumers can purchase fruits and vegetables year-round at lower prices than if they depended only on U.S. production. Canada and Mexico have simply capitalized on greenhouse production (although some firms operating in Mexico are U.S.-owned), and U.S. producers have not responded. Rather than trying to ‘tariff’ their way to a trade surplus, the underlying causes for the U.S. agricultural tariff deficit should be examined. It will always be difficult to have a surplus when the U.S. is an exporter of bulk commodities, especially since processed commodities bring a much higher price. Biofuels (using bulk agricultural commodities for energy) are an example of processing, but the U.S. is dependent on other countries for consumer-oriented commodities such as tomatoes. In addition, the U.S. has not had an FTA in more than 13 years, while Australia, the EU, and New Zealand have signed more than 50 agreements each. Given that agriculture has high market access barriers, the way to more exports is usually through more FTAs.
Most of this work is from Beckman et al. (2026)
References
Agriculture and Agri-Food Canada. 2025. “Statistical Overview of the Canadian Greenhouse Vegetable and Mushroom Industry-2024.” Government of Canada.
Aguiar, Angel, Uris Baldos, Maksym Chepeliev, Erwin Corong, and Thiago Simonato. 2025. “The Global Trade Analysis Project (GTAP) Data Base: Version 12.” Journal of Global Economic Analysis 10(2), 1-45.
Beckman, Jayson, Stephen Morgan, and Angelica Williams. “Understanding the US Agricultural Trade Balance.” Choices 41(1): 1-11.
Cook, Roberta, and Linda Calvin. 2005. “Greenhouse Tomatoes Change the Dynamics of the North American Fresh Tomato Industry.” Economic Research Report No 2, Economic Research Service, United States Department of Agriculture.
Foreign Agricultural Service (FAS). 2026. “Global Agricultural Trade System.” United States Department of Agriculture.
Francis, Norval. 1998. “Canada Tomatoes and Products: Canadian Greenhouse Tomatoes.” Foreign Agricultural Service Gain Report: CA8067, United States Department of Agriculture.
Guan, Zhengfei, Feng Wu, and Trina Biswas. 2017. “The US Tomato Industry: An Overview of Production and Trade.” FE1027, University of Florida.
Mandujano, Manuel. 2025. “Mexico Tomatoes and Products Annual.” Foreign Agricultural Service Gain Report: MX2025-2026, United States Department of Agriculture.
National Agricultural Statistical Service (NASS). 2026. “QuickStats.” United States Department of Agriculture.
Purdy, Jake. 2005. “High-tech Vegetables: Canada’s Booming Greenhouse Vegetable Industry.” Government of Canada.
Jayson Beckman, Associate Professor
Department of Agricultural Economics
Michael Yanney Chair, Yeutter Institute
University of Nebraska-Lincoln
jbeckman12@unl.edu