
Content
March 11, 2026
Potential Agricultural Price Impacts of Chinese Trade Retaliation by Margarida Noelia Aguiar Cunha Souza, Richard Perrin and Lilyan E. Fulginiti
Here, we explore how the Chinese response to the U.S. tariff threats might affect U.S. agricultural markets. China’s retaliation has involved soybeans, its largest agricultural import from the U.S. In a departure from recent history, China recorded near-zero imports of U.S. soybeans from May through November 2025. Although imports resumed following a bilateral agreement reached later in the year, the volume purchased during 2025 was only about a quarter of the level of recent years.
China is the largest soybean importer in the world, purchasing about 60% of all soybeans traded internationally, with Brazil and the United States as its main suppliers historically. Prior to the 2018 trade war, China alone accounted for 61% of U.S. soybean exports, meaning that roughly 29% of total U.S. soybean production was shipped to China. So, the Chinese soybean trade certainly has an impact on the U.S. soybean market.
In the midst of the recent tariff upheavals, we constructed an economic model to examine the potential impacts on agricultural market prices of China’s potential retaliation. Even though our tariffs and their retaliations are still under negotiation, here we consider the implications of a 14% reduction in Chinese soybean imports as a baseline measure of what is at stake.
A review of what is happening in 2025-2026
In February 2025, the White House announced higher tariffs on imported Chinese goods, further escalating trade tensions between the two countries. In response, China retaliated by imposing new tariffs on U.S. imports, and by implementing export controls and launching an antitrust investigation with particular focus on U.S. agricultural products such as soybeans, pork, beef, and vegetables (PIIE, 2026). More specifically, China imposed a 20% tariff on U.S. soybeans, and when combined with China’s Value-Added Tax (VAT) and Most-Favored-Nation (MFN) duties, the total import rate on U.S. soybeans rose to 34% in 2025 (Colussi and Langemeier, 2025). Although the 20% tariff was 5% lower than had existed previously, China ordered virtually zero new soybean imports from the U.S. prior to November 2025, but during the interim, it did import record levels from Brazil. China thus accounted for only about 20% of total U.S. soybean exports in 2025 (Figure 1), well below its historical share. While the U.S. redirected exports towards a more diversified set of destinations[1], this reallocation was not sufficient to offset the reduction in Chinese purchases.
On October 30, 2025, the United States and China reached an agreement in which China committed to reopen its market to U.S. soybeans and purchase at least 12 million metric tons (MMT) during the final two months of 2025, as well as 25 MMT over each of the subsequent three years (White House, 2025). But still, 25 MMT per year is 14% less than the 2020-24 average (see Figure 2). Such a reduction would result in financial losses for U.S. soybean farmers, and in this article, we examine quantitatively the potential agricultural market implications of a 14% reduction in Chinese purchases of U.S. soybeans over the next three years.
This has happened before
Chinese retaliation in the form of soybean tariffs is not a first. In response to U.S. tariffs imposed on Chinese goods in 2018, China imposed a 25% retaliatory tariff on U.S. soybeans, making them relatively more expensive than those produced in South America. China then redirected its imports toward Brazil and other suppliers. Figure 3 shows that the Chinese share of U.S. soybean exports fell to just 19% in calendar year (CY) 2018, far below the 2014–2017 average share of 61%. Losses for U.S. soybean farmers were estimated at $3.2 billion that year (Adjemian, Smith, and He, 2021). Following the 2020 Phase One Agreement[2], the share of U.S. soybeans in China’s imports rose to about 54% from 2020 to 2024—equivalent to roughly 25% of U.S. soybean production. In 2024, revenues from U.S. soybean exports to China totaled $12.64 billion.
Figure 1 - U.S. Soybean Export Shares by Destination: 2020–24 Average vs. 2025
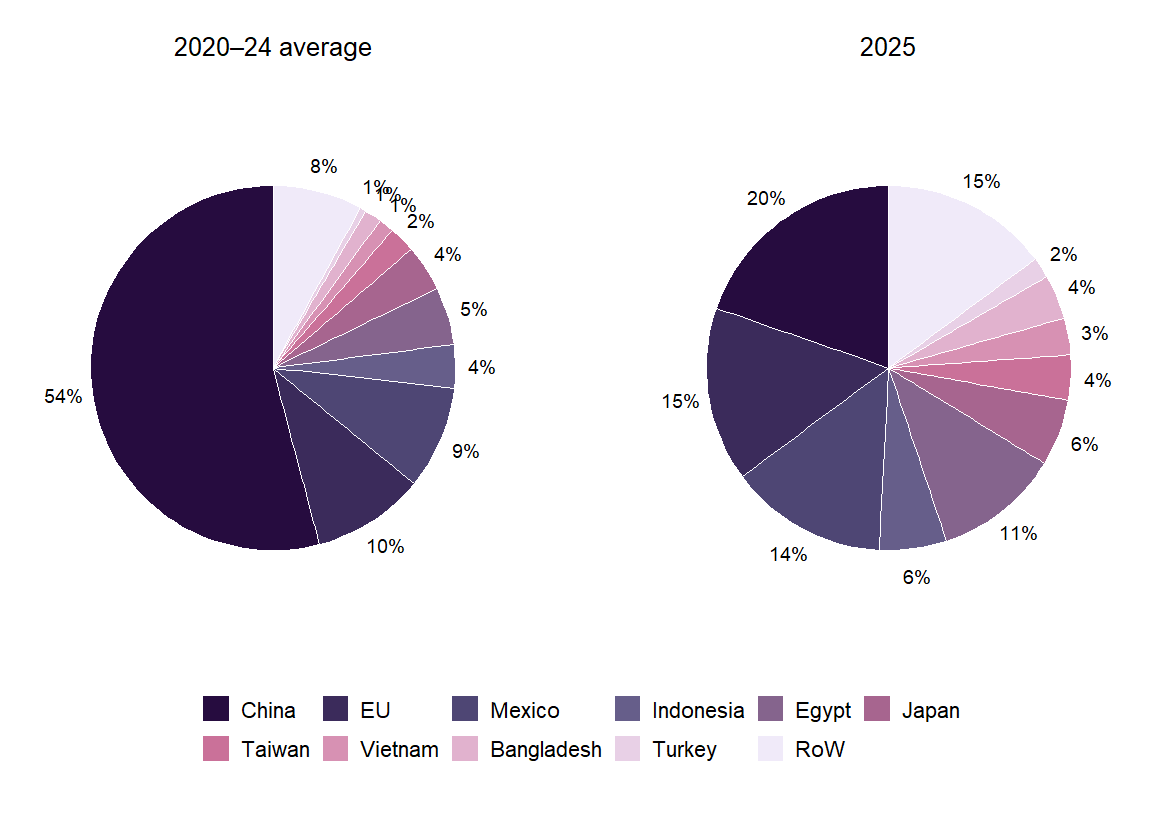
Source: USDA-FAS (2026a).
Figure 2: U.S. Soybean Exports to China: 2020–2024 Average vs Commitment over next three years (Million Metric Tons, MMT)
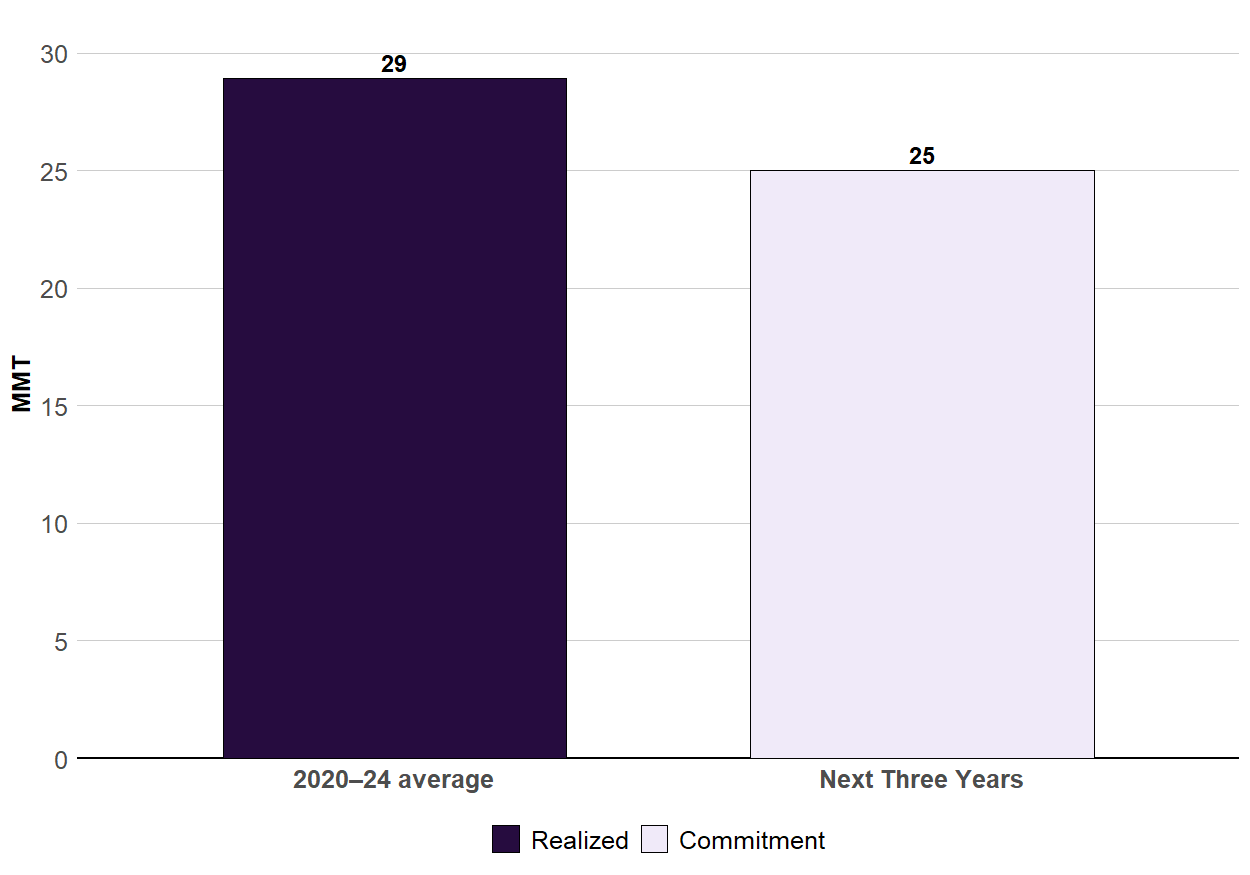
Source: USDA-FAS (2026a).
Figure 3 – U.S. Soybean Production and Exports (Marketing Year, MY) and Export Destinations (Calendar Year, CY)
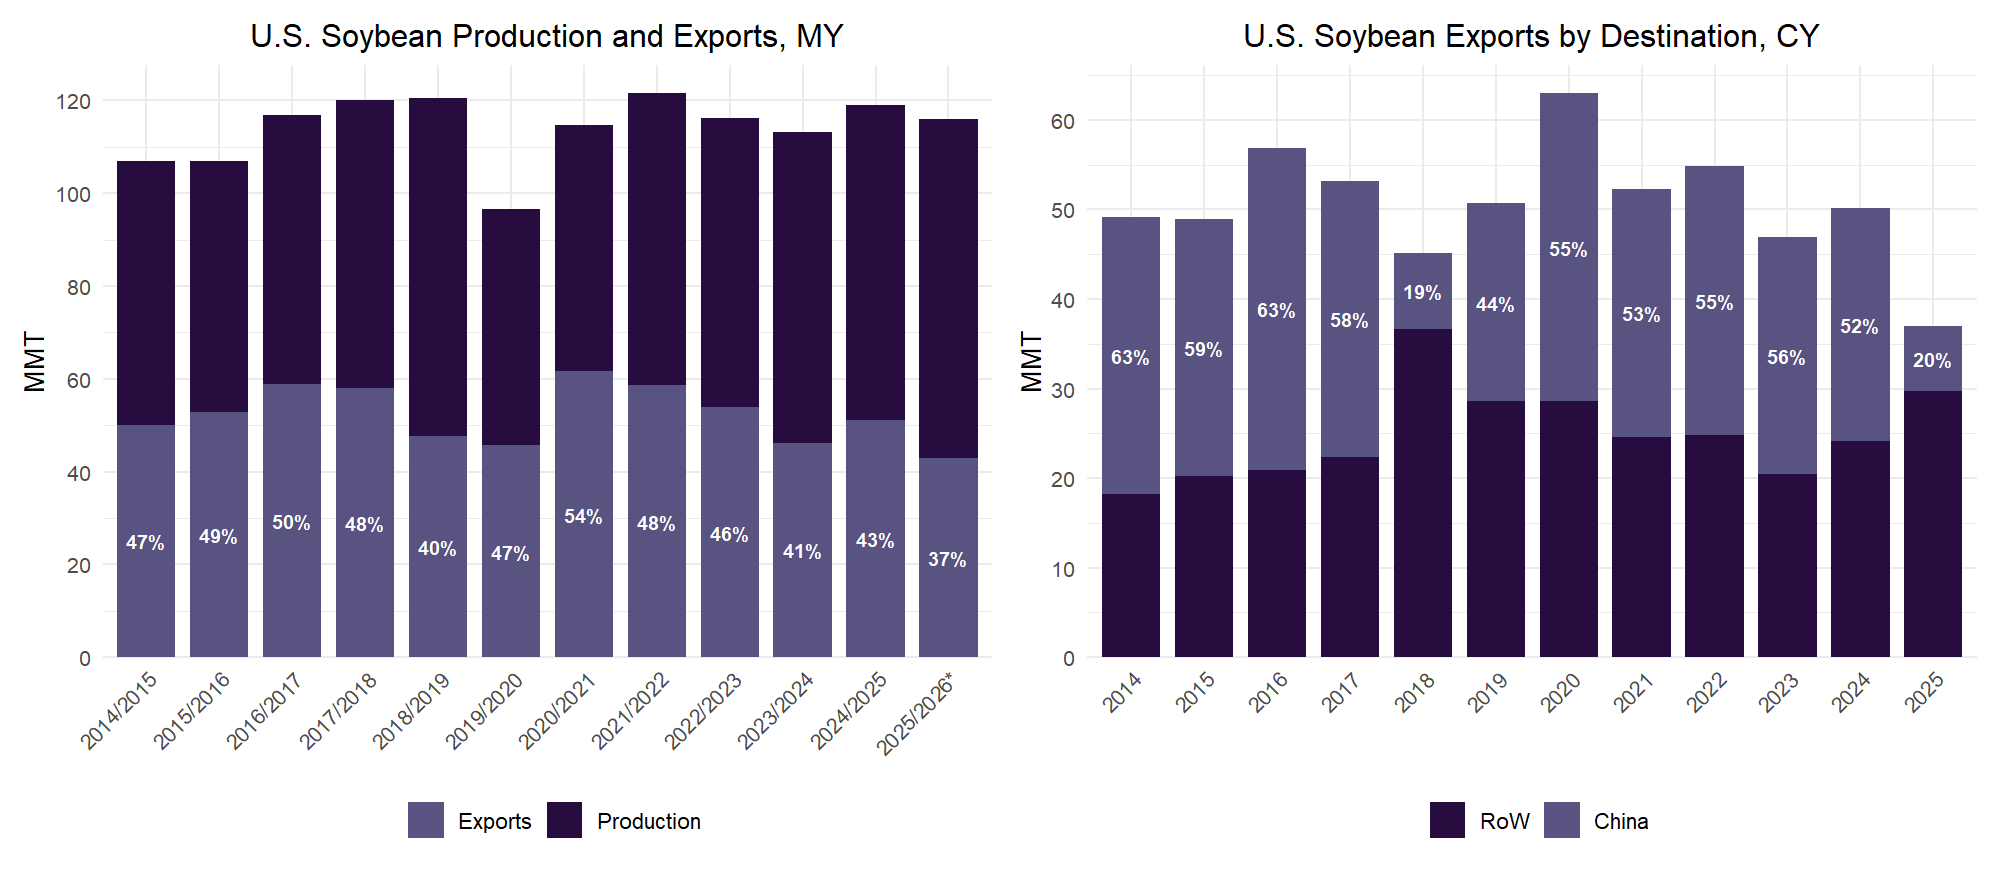
Source: USDA-FAS (2026a), USDA-FAS (2026b).
Note: MY data follow the U.S. soybean marketing cycle from September through August of the following year. CY data are reported from January through December of the same year. Data for 2025/2026* is a forecast by USDA-FAS (2026b).
Expected outcomes of retaliation
We cannot anticipate very well the impact that 14% reductions in Chinese imports will have over the next three years because there will be many other market disturbances. But our simulation model allows us to estimate what would have been the impact on the average 2020-2024 agricultural markets had the import reductions occurred then. This gives us an idea of the impact of the retaliation alone, without the confounding impacts of war, trade disruptions, and other market disturbances over the coming months.
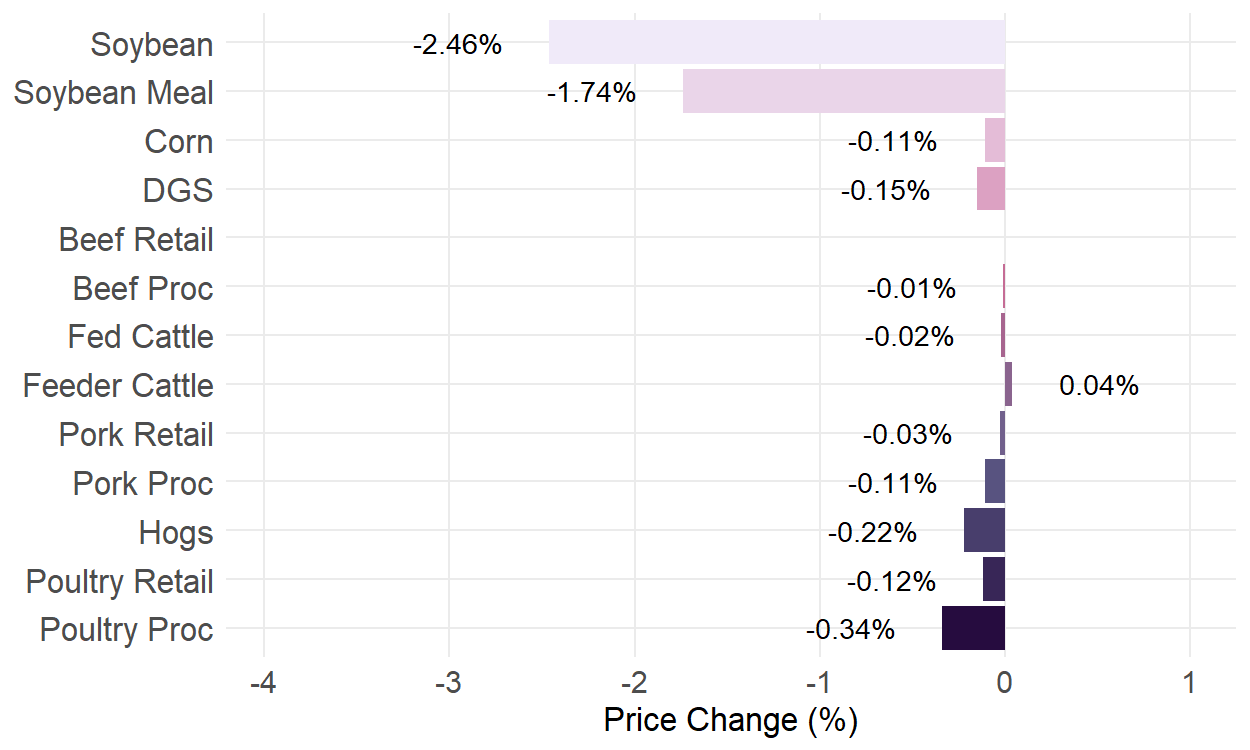
The impact of a 14% reduction in Chinese imports of U.S. soybeans on the 2020-2024 U.S. agricultural markets would naturally have fallen most heavily on the crop markets. We have identified a decrease in soybean price of about -2.5% and a reduction in quantity produced of about -0.7%. Corn price would have been reduced much less, only about -0.1%, resulting from a small increase in production due to a reallocation of land from soybeans to corn. These crop price reductions would have reduced the price of soybean meal by about -1.7% and the price of distillers grains and solubles (DGS) by about -0.2%. The quantity of soybean meal would have risen about 1.1%, and the quantity of DGS would have increased negligibly.
These reductions in feedstuff prices would have carried forward into the livestock markets, encouraging slightly more production, resulting in slightly lower prices. Poultry and pork production have fairly rapid turnovers relative to the beef sector, and feedstuffs are a large fraction of their production costs, so those sectors’ supply chains would have experienced stronger responses to the lower feed prices than the beef sector. But even so, those impacts would not have been very large – increases of less than 0.1% in production, with price reductions at the processing level of about -0.3% for poultry and -0.11% for pork. Beef markets would have been less responsive to the lower feed costs, with quantities increasing only about 0.01% along the supply chain. Feeder calf prices would have increased perhaps 0.04% even though fat cattle prices would have fallen by -0.02%.
Consumers would have benefited slightly. At the retail level, poultry prices would have fallen by -0.1%, pork prices by about -0.03%, but retail beef prices would have remained virtually unchanged.
While these impacts appear to be small in percentage terms, they can be significant amounts for the sectors involved. For corn-soybean farmers, the simulated price and quantity adjustments translate into producer losses of approximately -$1.3 billion. Beef feedlots would have lost about $0.015 billion, but cow-calf producers, the only agricultural sector to benefit from higher prices, would gain about $0.023 billion.
Bear in mind that these are predicted effects of a reduction equivalent to about 14% to the level of 25MMT per year, to which China committed in late 2025. But we note that China did not achieve the late 19.5 MMT commitment for 2025 until February of this year. And the negotiations are continuing, with soybean tariffs being explicitly on the table for discussion during President Trump’s visit to China in early April. Nonetheless, our calculated impacts provide a baseline estimate of the impacts of reductions in soybean sales to China.
Figure 4: Expected price changes under a 14% reduction of U.S. soybean exports to China
Summary
U.S. and world trade patterns are being upended by the administration’s tariff negotiations in 2025. In the wake of these, China suspended purchases of soybeans from the U.S., even though in the past, they have purchased about 25% of the U.S. soybean crop. Although a trade agreement was reached on October 30, 2025, that included the commitment by China to purchase about 25 MMT annually over the next three years, this would still be a reduction of about 14% relative to the 2020–2024 average. Our simulation indicates that reductions of this size would have reduced the U.S. soybean price by about -2.5%, triggering adjustments throughout the agricultural sector. We estimate that U.S. corn-soybean farmers would have incurred short-run losses of approximately $1.3 billion. Lower crop prices would have stimulated relatively minor expansions in pork and poultry markets.
References
Adjemian, M. K., Smith, A., & He, W. (2021). Estimating the market effect of a trade war: The case of soybean tariffs. Food Policy, 105, 102152. https://doi.org/10.1016/j.foodpol.2021.102152
Colussi, J., & Langemeier, M. (2025, September 12). U.S. soybean harvest starts with no sign of Chinese buying as Brazil sets export record. farmdoc daily, 15(173). https://farmdocdaily.illinois.edu/
PIIE. (2026). Trump’s trade war timeline 2.0: An up-to-date guide. Peterson Institute for International Economics. Available at: https://www.piie.com/blogs/realtime-economics/2025/trumps-trade-war- timeline-20-date-guide
U.S. Department of Agriculture, Foreign Agricultural Service. (2025a). China Phase One Agreement. https://www.fas.usda.gov/topics/china-phase-one-agreement
U.S. Department of Agriculture, Foreign Agricultural Service. (2026a). Export sales query system. https://apps.fas.usda.gov/esrquery/esrq.aspx
U.S. Department of Agriculture, Foreign Agricultural Service. (2026b). Market and Trade Data. https://apps.fas.usda.gov/psdonline/app/index.html#/app/advQuery
U.S. Soybean Board. (2025). Soybean meal consumption by category. https://marketviewdb.unitedsoybean.org/dashboards/?bi=US_Meal_FeedUsebySpecies_Annual
White House. (2025). Fact sheet: President Donald J. Trump strikes deal on economic and trade relations with China. https://www.whitehouse.gov/fact-sheets/2025/11/fact-sheet-president-donald-j-trump-strikes-deal-on-economic-and-trade-relations-with-china/
Margarida Noelia Aguiar Cunha Souza
Graduate Research Assistant
mdeaguiarcunha2@huskers.unl.edu
Richard Perrin
Jim Roberts Professor
Department of Agricultural Economics
University of Nebraska-Lincoln
rperrin@unl.edu
Lilyan E. Fulginiti
Roy Frederick Professor
Department of Agricultural Economics
University of Nebraska-Lincoln
lfulginiti@unl.edu
[1] Figure 1 shows that the EU, Mexico, Indonesia, Egypt, Japan, Vietnam, Bangladesh, and Turkey increased their shares of U.S. soybean exports in 2025 relative to the 2021–2024 average, with the most pronounced increase occurring among Rest of the World (RoW) destinations.
[2] After prolonged negotiations during the trade tensions that began in 2018, the United States and China signed the Phase One Agreement in 2020. The deal required China to implement reforms in key areas such as intellectual property protection, technology transfer, agriculture, financial services, and currency and foreign exchange policy. It also included a commitment from China to substantially increase its purchases of U.S. goods and services in the following years (USDA-FAS, 2025).