
Content
February 18, 2026
Understanding Leverage by Timothy Meyer
Since the beginning of the Department of Agricultural Economics at the University of Nebraska, one of the main goals has been to help producers apply economic concepts to agricultural production…to do what economists assume all firms do: maximize profit. It is said that the producer who lauds his/her record yield is a revenue maximizer, whereas the producer who brags about a low break-even point is a cost-minimizer. With margins growing thinner, producers must be adept at both.
In AECN 201, Farm and Ranch Management, a large portion of the class takes production economic theories and operationalizes them and/or provides context. A good example of this are my prior Cornhusker Economics articles, “(Dis)economies of scale on the Family Farm,’ and ‘Reconciling the Paradox of Positive Profit and Negative Cash Flow.” In the same way, this article will unpack how profits, cash flow, return on equity (ROE), and Return on Assets (ROA) are all part of the broader financial topic of leverage.
Loosely defined, “leverage” is how much debt a firm uses in relation to equity. The leverage ratio, total debt/total equity, contextualizes an absolute amount of debt. $1,000,000 of debt may seem like a large amount, but to a firm with equity of $10,000,000, it is quite conservative. While the debt/equity ratio is useful in contextualizing overall debt, its relationship with the interest rate is a more sophisticated idea, and one that can help producers understand how wisely-used debt can enhance firm/farm performance.
Calling the debt/equity ratio the leverage ratio provides an important illustration. When a rusty bolt cannot be removed with a normal wrench, an extension can be used to multiply force. Moving a large rock with a crowbar illustrates the same concept.
So, what does debt use enhance? Profits, losses, and cash flow. To see this relationship, examine the table below.
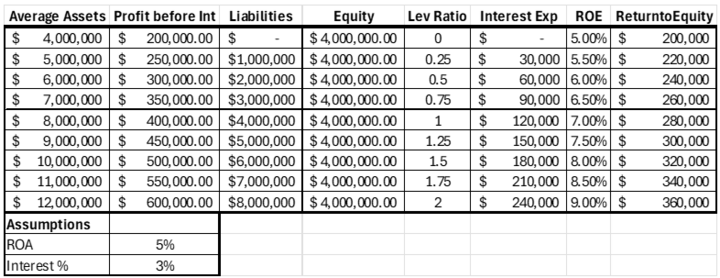
The Farm Financial Standards Council provides guidelines on calculating ROA so that comparisons can be made across farms/ranches as well as over different time periods. These adjustments mainly refer to unpaid family labor/management and interest. In this example, it is assumed that all labor and management are explicit expenses, so the column titled “profit before interest” is just that.
Return on Assets is a profitability ratio that contextualizes profit compared to assets under control. In this first case, it is assumed that the farm produces a profit equal to 5%, no matter the farm size or debt load. At each asset level, if the farm had no debt, ROA would be exactly equal to ROE, simply because Profits/Assets would be the same as Profits/Equity; a simple review of the accounting equation, Assets=Liabilities+OE, reinforces that if Liabilities are $0, Assets=Owner’s Equity.
Of course, that’s not the case in this scenario. Each asset level above $4,000,000 increases debt by the same amount. These $1,000,000 liability additions raise the leverage ratio by .25, as they represent one-fourth of owner’s equity.
In this case, leverage is overwhelmingly positive for the producer. Since the average interest rate (3%) is lower than the average return (5%), each borrowed dollar adds $.02 to profit and cash flow. In general, when ROA>I, then ROE>ROA.
Our example shows the systematic relationship between ROE and the profitable use of debt. Each time $1,000,000 of debt is added, the leverage ratio increases by .25. This, in turn, causes ROE to increase by .5%, and return on equity (cash flow) to increase by $20,000. This increase in cash flow is straightforward; each $1,000,000 of assets generates $50,000 of additional profit; after paying $30,000 of interest, the firm is left with the rest. To understand the increase in ROE, the following formula is helpful:
ROE = ROA + (ROA-i)(D/E)
This decomposition of ROE informs us that ROE starts with ROA, which is then adjusted for farm performance compared to the cost of borrowing (ROA-i), which is then multiplied by the leverage ratio (D/E). At this point, it may seem as though the article is pro-debt, as our example rewards leveraged equity and high levels of debt. It’s important to note that leverage works the other way as well, as depicted below:
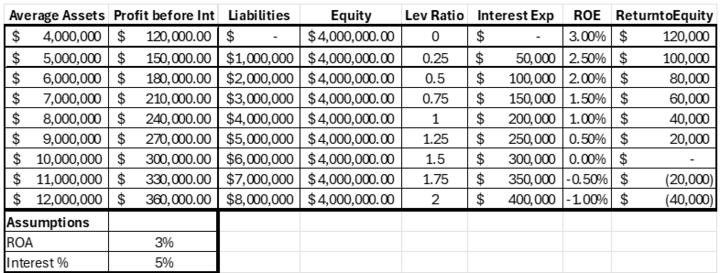
In this example, the only change made was that ROA and the average interest rate % were swapped; now ROA is 3% while the interest rate is 5%. While the operation is still profitable, it isn’t profitable enough to cover the additional interest expense. Getting bigger has increased profit before interest, but each level of additional debt will create a $20,000 cash flow burden.
These two examples illustrate how the use of debt enhances profit and cash flow, as well as exacerbating the consequences of poor performance. More importantly, the two examples illustrate why the interest rate, discount rate, and hurdle rate are used interchangeably in farm finance.
As borrowing rates have increased, the acceptable return of investments (the internal rate of return) acts like the assumed ROA in these examples. These increased borrowing rates create a taller hurdle for investments to clear, making managerial decision-making more important than ever before.
In the classroom, I often fight the idea that debt is bad. I’m sure this sentiment is partly a leftover from the 1980s, but more so, I think it is the protective nature of families. Most of us know a family member who has utilized debt to the point of bankruptcy. As our first example shows, smart investing utilizing debt financing is a good strategy to increase farm size, profitability, and liquidity.
Timothy Meyer
Associate Professor of Practice
Department of Agricultural Economics
University of Nebraska-Lincoln
tmeyer19@unl.edu