Cornhusker Economics Feb 28, 2024
2022 Census of Agriculture: Nebraska Highlights
By Kathleen Brooks and Brad Lubben
Introduction
Earlier this month, the United States Department of Agriculture National Agricultural Statistics Service published data from the 2022 Census of Agriculture. This data is collected every five years. The current article highlights a few of the Nebraska numbers. Two significant highlights from the data are the total number of farms and the total value of production. U.S. farm numbers declined modestly in the U.S. from 2.04 million in 2017 to 1.90 million in 2022. The total value of production for U.S. farms and ranches increased substantially from $388.5 billion in 2017 to $543.1 billion in 2022. Crop production accounted for about 52% of the total value of production, while livestock accounted for the remaining 48% of production.
Nebraska farm numbers and value of production
The total number of farms in Nebraska decreased from 46,332 in 2017 to 44,479 farms in 2022, with the average farm size increasing from 971 acres in 2017 to 989 acres in 2022. Figure 1 represents the number of farms in Nebraska by the value of sales. The number of farms with less than $500,000 in sales declined from 38,280 farms in 2017 to only 35,091 farms in 2022, while the number of farms with over $500,000 in sales increased from 8,052 farms in 2017 to 9,388 farms in 2022. Approximately 21% of farms in Nebraska produced less than $2,500 in sales, 34% of farms produced between $2,500 and $99,999, 24% of the farms produced between $100,000 and $499,000 in sales, with the remaining 21% of farms producing over $500,000 in sales.
Figure 1: Number of farms in Nebraska, by Sales Classification, 2002-2022

While the total number of farms in Nebraska has declined, the value of agricultural production has continued to increase. In 2022, Nebraska ranked number 4 in agriculture sales with sales of $29.41 billion (Figure 2). This is an increase from $21.98 billion in 2017. The value of agricultural production in Nebraska has more than tripled since 2002. Livestock sales continue to exceed the value of crop sales (Figure 2). Approximately 52% of the value was from livestock sales ($15.4 billion) and the other 48% from crop sales ($14 billion). Note that as the value of agricultural sales has increased, so have total farm production expenses. Total farm production expenses were $23.4 million in 2022 an increase from $19.37 in 2017.
Figure 2: Nebraska Value of Agricultural Production, 2002 - 2022

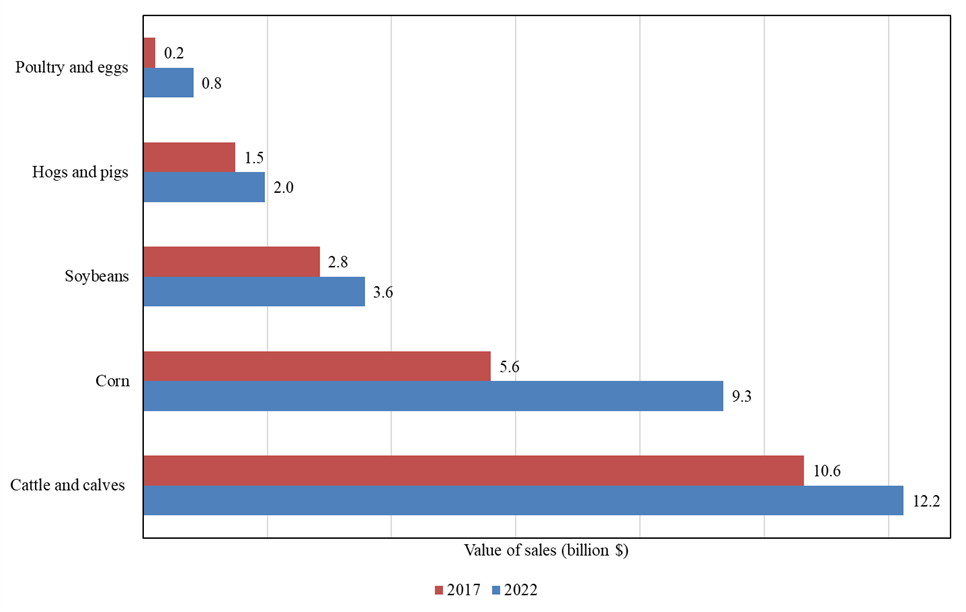
In 2022, cattle and calves were the top-ranked commodity, representing 41.6% of the total sales in Nebraska (Figure 3). Corn was the second-ranked commodity at 31.8% of the total sales, followed by soybeans at 12.1% and hogs and pigs at 6.7%. Poultry and eggs moved into the top 5 in 2022, with a significant increase in value of sales up $616 million compared to 2017.
Figure 3: Nebraska's Top 5 Commodities, 2022

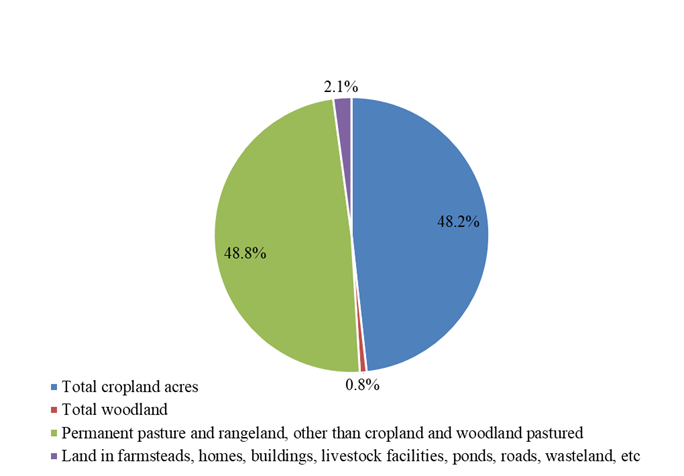
Total acres of farmland decreased from 45.0 million acres to 44.0 million acres between 2017 and 2022. Figure 4 shows the percentage of land acres across categories. In 2022, approximately 48.2% of the farmland acres were in cropland and 48.8% were in permanent pasture and rangeland (other than cropland and woodland pastured).
Figure 4: Nebraska Land Use

Characteristics of Nebraska Producers
In 2022, the average age of a Nebraska producer was 56.9 years of age, slightly lower than the average U.S. farm producer age of 58.1 years. Approximately 33% of the producers are female and 67% are male, very similar to the numbers in 2017. While 57.2% of the male producers in Nebraska indicate farming to be their primary occupation, only 31.8% of women say that farming is their primary occupation.
Young producers (classified as producers under the age of 35) increased from 8,226 producers in 2017 to 9,031 producers in 2022. The number of new and beginning producers increased in 2022 over 2017. They represent 26.1% of all producers in Nebraska with an average age of 43.7 years. Of the new and beginning producers, only 31.6% indicated that farming was their primary occupation.
References:
USDA National Agricultural Statistics Service, 2022 Census of Agriculture. Complete data is available at https://www.nass.usda.gov/AgCensus/.
Kathleen Brooks
Associate Professor
Associate Interim Department Head
Department of Agricultural Economics
University of Nebraska-Lincoln
kbrooks4@unl.edu
Brad Lubben
Extension Associate Professor and Policy Specialist
Department of Agricultural Economics
University of Nebraska-Lincoln
brad.lubben@unl.edu