Cornhusker Economics Feb 1, 2023
2023 Nebraska Crop Production Budgets - Higher Costs and Risks
The 1Nebraska crop budgets are available for the 2023 production season. The 84 budgets indicate cost of production increases. Estimated average economic or total costs per bushel for 2023 corn production are expected to be at least 23% to 25% greater than last year. Soybeans are estimated to be 13% to 19% more in economic costs per bushel, with wheat production costs having jumped over 20% compared to last year and running as high as 63% higher over the last two years combined. Cost scenarios for individual producers can vary based on their timing of input purchases and price variabilities.
Fuel, fertilizer, and field operation costs are the main drivers of projected production cost increases in the 2023 enterprise budgets. Ownership costs of land and rental rates are factors adding to cost increases as well, with the all-land2 average value in Nebraska rising 16% for the year ending February 1, 2022.
Along with increased costs come increased financial risk exposure associated with yield or market changes. It is important to develop cost-of-production baseline information to utilize market opportunities as they are available, consider input decisions, and make timely risk management decisions. Knowing projected enterprise costs can provide confidence in decision-making.
Nebraska Extension crop specialists and economists annually prepare the University of Nebraska crop budgets. Additional crops in the 2023 budget reports include: alfalfa, dry edible beans, grain sorghum, grass hay, millet, peas, oats, sugar beets, and sunflowers. The budget reports are provided in several formats, including cash and economic budget reports from the Agricultural Budget Calculator (ABC) program. Producers and agricultural managers can use ABC to create their own crop enterprise budgets or modify the 2023 Nebraska budgets that are downloadable in the program. Excel and printable PDF report versions are available as well.
The Nebraska budgets are created using assumptions thought to be valid for many producers across the state, however, each farming operation is unique, and producers should take the time to examine individual budgets and modify them as needed before using them for decision-making purposes.
Production Cost Jumps since 2021
Table 1 provides a comparison of each Nebraska corn budget from 2021 to 2023, providing cost projections per bushel on a cash and economic basis. For the dryland corn budgets combined, at a 150-bushel yield average, cash costs increased $1.08 per bushel and economic costs increased $1.49 per bushel over the two-year period. A 239-bushel average yield is calculated from the combined irrigated corn budgets. 2023 cash costs increased an average of $1.10 over 2021 including a $0.55 per bushel increase from 2022 to 2023. Total or economic costs per bushel for the combined irrigated corn budgets jumped 18% from 2021 to 2022 and are projected to be another 25% for 2023.
Table 2 provides a similar comparison with 2021-2023 cost of production figures on soybeans. Noted in the table is a $2.84 per bushel average increase in the combined irrigated soybean budget economic costs, and over a $1.00 increase in dryland and irrigated soybean cash costs per bushel for both 2022 and for 2023 budgets. On average, total economic costs are estimated at $10.54 per bushel for dryland soybeans and $10.57 per bushel for irrigated soybeans.
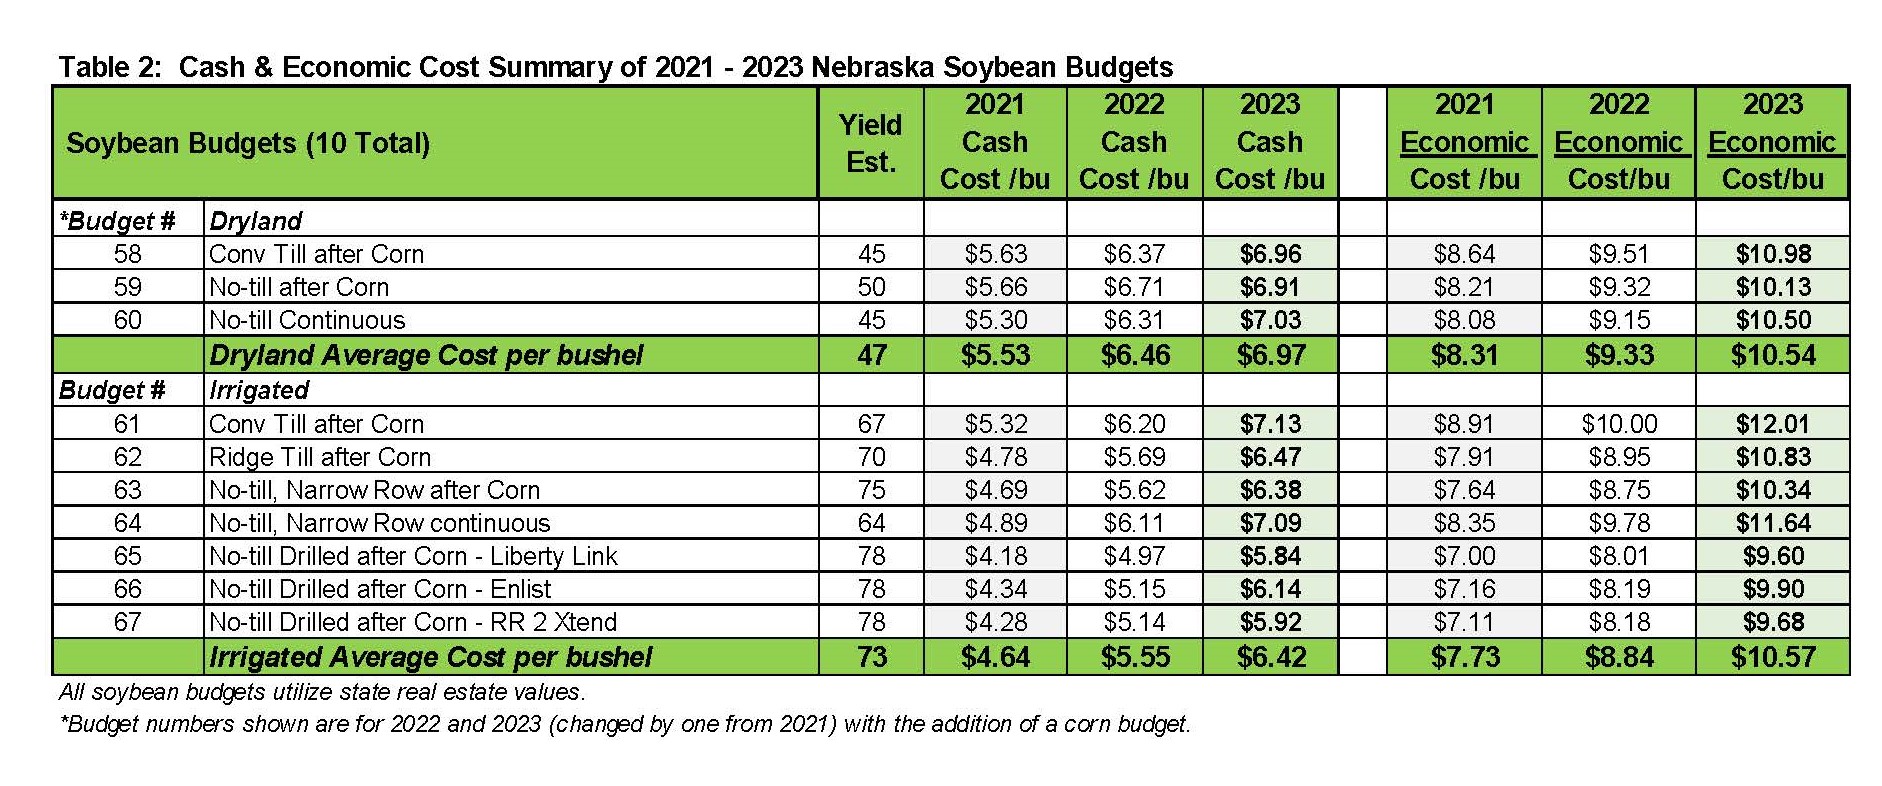
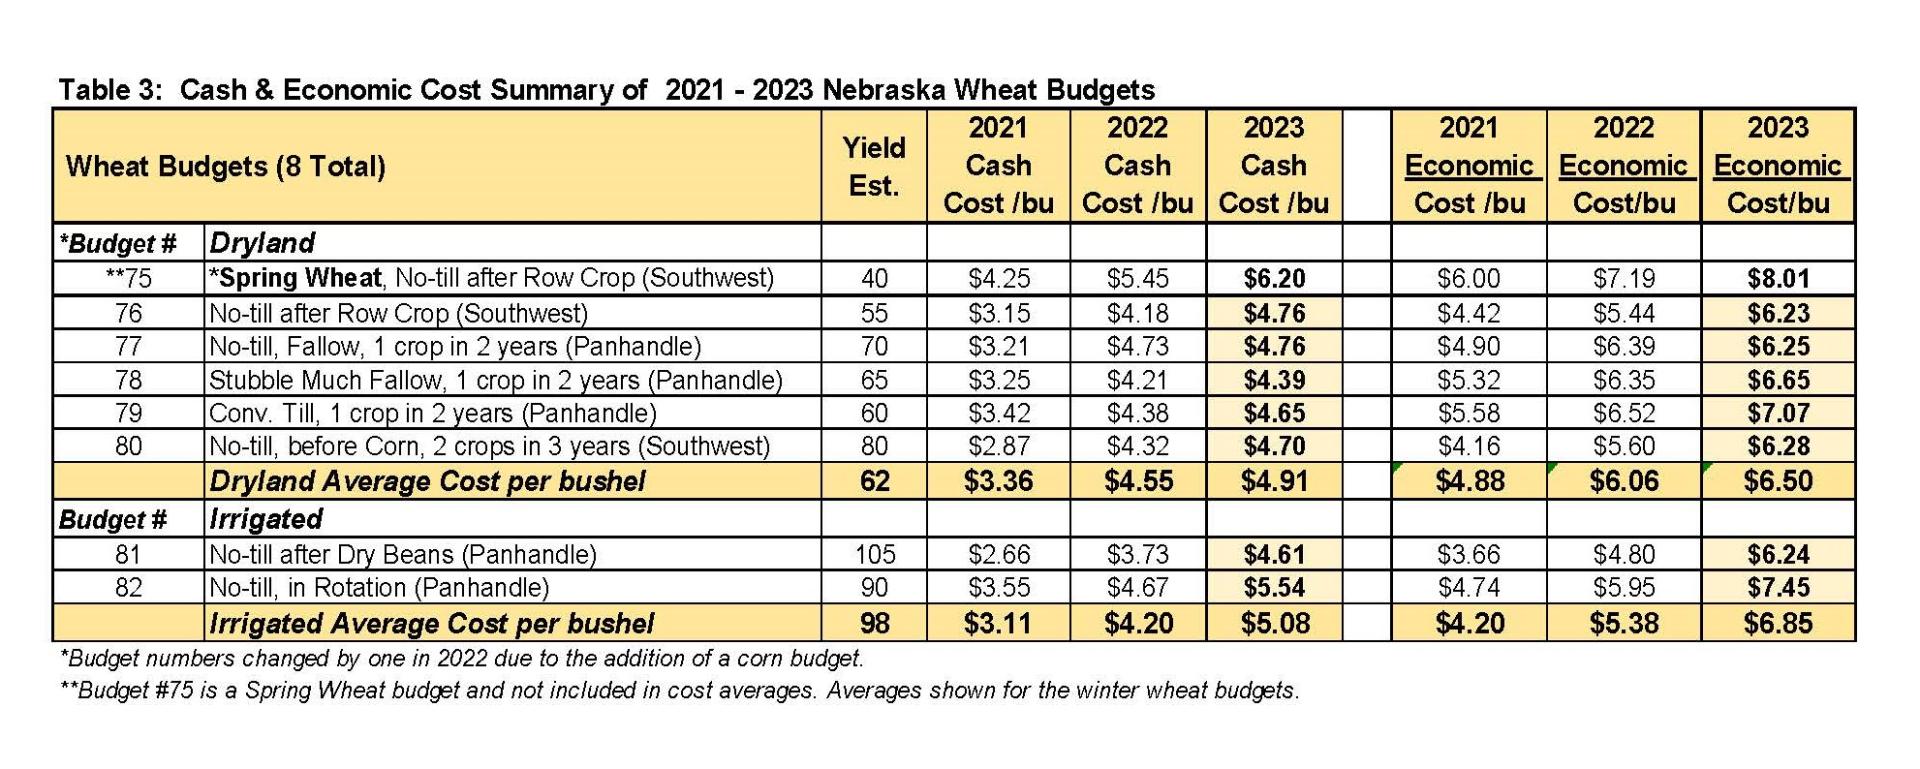
Table 3 shows the largest percentage cost per bushel increases from 2021 to 2023 on both a cash and economic basis for the combined dryland and irrigated wheat enterprises in Nebraska, pushing average per bushel total costs estimates to $6.50 and $6.85, respectively.
The 2023 Nebraska budgets are figured based on a projected yield to calculate both a total economic and a cash cost per unit of production. Cash costs do not include the ownership cost of machinery and equipment used in field operations, nor a real estate opportunity cost when land is owned. Conversely, economic costs include an opportunity cost of land and equipment, plus depreciation costs of machinery and equipment.
Land values from the 22022 Nebraska Farm Real Estate Report are used in the budgets to calculate land ownership opportunity costs. If an operator rents crop ground, land value and real estate taxes can be eliminated in the budget and replaced by the amount paid for cash rent. In this scenario, cash costs will increase due to the added cash rent expenses.
In addition to depreciation and ownership costs of machinery and equipment, field operation costs include labor, fuel, and repair expenses. Repairs and depreciation expenses are figured using the Society of Agricultural Engineers formulas and equations for power units and implements. The 2023 labor rate remained the same as last year’s figure of $25 per hour. Labor costs for each operation are calculated using machinery accomplishment rates and are adjusted for the additional time required for getting machinery ready, adjusting machinery, and handling fertilizer and crop inputs.
Budgets Should be Modified Based on Operations and Input Price Changes
Prices for materials and services for the 2023 crop budgets were based on August to October 2022 prices. As observed a year ago, input prices were rising sharply in many cases soon after the budgets were published. For 2023, we cannot accurately predict the movement of material and service prices, therefore, it is highly recommended that producers utilize the Nebraska budgets as a guide to prepare their own enterprise budgets, updating expense figures as necessary.
In the 2023 crop budgets, fertilizer costs were figured generally at $1.00 per pound of nitrogen. Diesel fuel was assumed at $3.83 per gallon for 2023, with 15% of the fuel cost added to the budget for oil and lube costs. Pesticide prices over the last year varied, with some increasing slightly and others staying the same or lower. A complete list of material input prices is shown in the budget reports (“Material Inputs” tab of the ABC program or pages 8-10 of the PDF report).
Resources:
1Klein, R., McClure, G., 2022 Nebraska Crop Budgets, University of Nebraska – Lincoln, cap.unl.edu/cropbudgets
2 Jansen, J., Stokes, J., Nebraska Farm Real Estate Report 2022 Final Results. University of Nebraska – Lincoln, cap.unl.edu/realestate
Glennis McClure
Extension Educator, Farm & Ranch Management Analyst
Department of Agricultural Economics
University of Nebraska – Lincoln
gmcclure3@unl.edu
402-472-0661