Cornhusker Economics March 13, 2024
2024 Nebraska Farmland Values and Cash Rental Rates
By Jim Jansen and Jeffrey Stokes
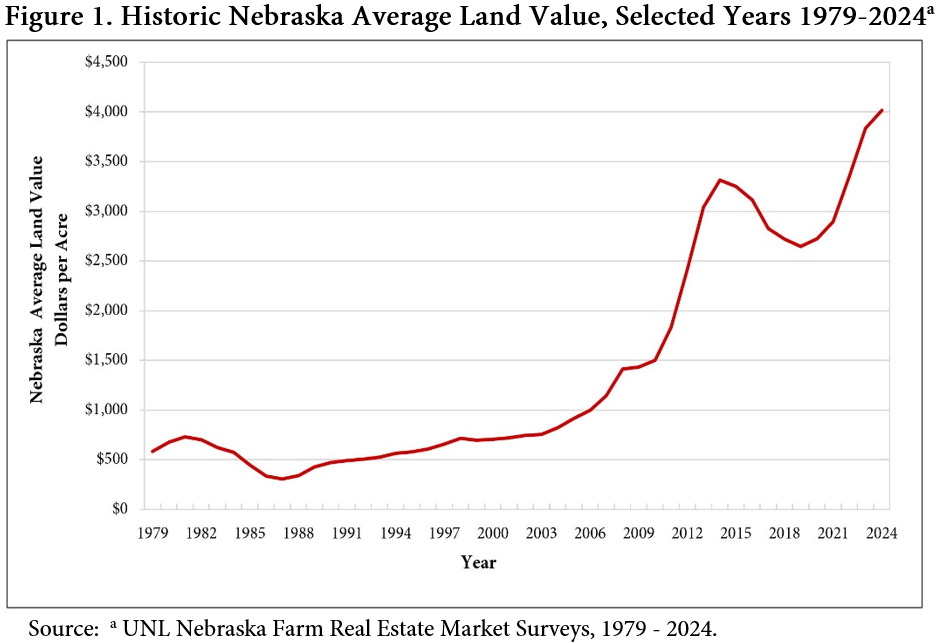
The market value of agricultural land in Nebraska increased by 5% over the prior year to an average of $4,015 per acre, according to the 2024 Nebraska Farm Real Estate Market Survey (Figure 1 and Table 1). This marks the third consecutive year of increases in the market value of agricultural land in Nebraska, setting another high in the non-inflation-adjusted statewide land value in the survey's 46-year history.
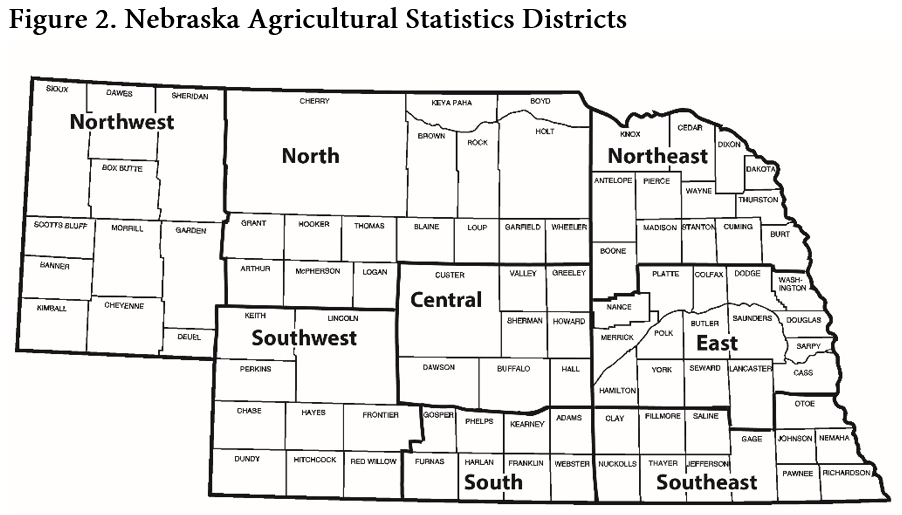
The University of Nebraska-Lincoln’s Department of Agricultural Economics annually surveys land industry professionals across Nebraska, including appraisers, farm and ranch managers, agricultural bankers, and related industry professionals. Results from the survey are divided by land class and summarized by the eight Agricultural Statistic Districts of Nebraska (Figure 2).
Land industry professionals responding to the annual survey attributed the rise in Nebraska agricultural real estate values to purchases for farm expansion, current livestock prices, 1031 tax exchanges, the amount of land offerings for sale, and as a hedge against inflation. Farms or ranches in strong financial positions look to expand their operations by purchasing additional land. Competition in the industry remained strong as operators faced lower land offerings available for sale. Inflation pressure continued from the prior year as many operations invested in land or purchased agricultural equipment to hedge against future increases.
The demand for farm expansion was partly driven by a net farm income of approximately $7.8 billion in Nebraska for 2023. Key crop inputs such as fertilizer and fuel declined by $229 million over the prior year, while overall production expenses increased by 7.6%. Lower corn and soybean prices reduced crop receipts across the state by $2.3 billion but were partially offset by higher cattle and calf prices of $2.44 billion (Lubben, 2023). Forecast estimates for Nebraska place net farm income in 2024 down due to lower crop prices.
Industry participants motivated in buying or selling land utilized 1031 tax exchanges when applicable to minimize capital gains and reallocate their investment position, contributing to steady real estate values. Limited land offerings for sale across the states in the Tenth District of the Federal Reserve Bank of Kansas City provided a degree of resiliency in the real estate markets. The share of land purchased by farmers or ranchers increased to almost 80% across these states (Cowley et al, 2024).
In response to inflationary concerns, many operations acquired tangible assets, such as land, machinery, and equipment, to hedge against rising prices. The Federal Reserve's policies to slow inflationary pressure have led to agricultural real estate loans moderating around 8% across states in the Tenth District (Kauffman & Kreitman, 2024). Survey participants reported that these underlying financial forces guided the agricultural real estate markets.
The estimated market value of dryland cropland without irrigation potential rose 3% across the state compared to the prior year (Table 1). Districts in the North, Central, Southwest, and South increased by 5% to 8%. The average increases in the other five districts were less than 4%. Dryland cropland with irrigation potential rose 5% for the state. Districts in the Northeast, East, and South reported increases ranging from 5% to 9%, whereas the other regions reported changes ranging from -1% to 4%. Water usage policies may impact the development of new irrigated cropland.
Center pivot irrigated cropland averaged 4% higher over 2023, with the Northeast, Central, and East leading Nebraska from 5% to 8%. The Northwest, North, South, and Southeast rose between 2% and 4%, while the Southeast declined 3%. Modest gains also carried over to gravity-irrigated cropland, with an average increase of 3% in 2024. Changes in market value ranged from a 4% gain in the North and East to a -2% decline in the Southwest. Gains moderated for the irrigated land classes compared to the prior year with lower grain prices.
The gains in the grazing land and hayland market values ranged from 6% to 8%. Nontillable grazing land led the three land classes at 8% as operators competed for additional acres due to rising cattle prices. Districts in the North, East, Southwest, and Southeast led the gains ranging from 7% to 13%. Tillable grazing land followed with an increase of 7%, and hayland experienced a gain of 6%. Cow-calf producers capitalized higher cow-calf prices into these three land classes across competitive areas of the state.
Dryland and irrigated cropland rental rates moderated across Nebraska in 2024 (Table 2). Survey responses indicated lower crop prices have led to the reported changes and moderation in cropland cash rental rates. Favorable crop yields across the United States in 2023 have increased grain stocks and brought grain prices down from near-record levels. Input prices for seed, fertilizer, and chemicals have leveled off but remain elevated for specific key inputs. Flexible lease provisions can help manage price uncertainty and production risk when formulating a cash lease arrangement for 2024.
Cash rental rates for dryland and irrigated cropland reported changes ranging from a 7% decline to a 5% gain over the prior growing season. The cash rental rates for irrigated cropland assume the landlord owns the entire irrigation system. If the tenant provides an irrigation system component, the rental rate will be adjusted lower to reflect the contribution. Survey participants expressed concerns about drought, input expenses, and water availability for the upcoming growing season in certain regions. Accounting for actual revenue, production expenses, or irrigation limitations might be features to consider in a flexible lease for 2024.
Pasture and cow-calf pair rental rates trended higher across Nebraska in 2024 (Table 2). The rates increased by approximately 5% to 8% compared to the previous grazing season. Rising grazing land cash rental rates follow higher cattle prices with the decline in national inventories. Cash rental negotiations should include early removal provisions when accounting for drought considerations for the upcoming growing season.
| Type of Land and Year | Agricultural Statistics District | ||||||||
|---|---|---|---|---|---|---|---|---|---|
| Northwest | North | Northeast | Central | East | Southwest | South | Southeast | Statec | |
| - - - - - - - - - - - - - - - - - - - - - - - - - - - - - Dollars Per Acre - - - - - - - - - - - - - - - - - - - - - - - - - - - | |||||||||
| Dryland Cropland (No Irrigation Potential) | |||||||||
| $/acre | 920 | 2,050 | 8,135 | 4,070 | 8,510 | 1,825 | 4,305 | 6,495 | 4,530 |
| % Change | 2 | 5 | 4 | 6 | 2 | 6 | 8 | 1 | 3 |
| Dryland Cropland (Irrigation Potential) | |||||||||
| $/acre | 980 | 2,470 | 9,725 | 4,415 | 9,975 | 2,130 | 4,745 | 8,370 | 6,390 |
| % Change | -1 | 4 | 9 | 4 | 5 | 2 | 5 | 3 | 5 |
| Grazing Land (Tillable) | |||||||||
| $/acre | 755 | 1,665 | 4,280 | 2,865 | 4,810 | 1,220 | 2,835 | 3,740 | 1,790 |
| % Change | 3 | 7 | 2 | 9 | 4 | 6 | 9 | 8 | 7 |
| Grazing Land (Nontillable) | |||||||||
| $/acre | 605 | 980 | 2,815 | 2,070 | 3,125 | 1,015 | 1,740 | 3,050 | 1,175 |
| % Change | 5 | 13 | 4 | 2 | 9 | 7 | 3 | 11 | 8 |
| Hayland | |||||||||
| $/acre | 945 | 1,790 | 3,975 | 2,815 | 4,420 | 1,935 | 2,380 | 3,830 | 2,350 |
| % Change | 2 | 7 | 3 | 8 | 11 | 10 | 5 | 4 | 6 |
| Gravity Irrigated Cropland | |||||||||
| $/acre | 2,790 | 4,630 | 9,885 | 7,425 | 11,715 | 4,280 | 8,010 | 8,955 | 8,145 |
| % Change | 1 | 4 | 1 | 3 | 4 | -2 | 2 | 6 | 3 |
| Center Pivot Irrigated Croplandb | |||||||||
| $/acre | 3,375 | 5,145 | 12,335 | 9,640 | 13,690 | 5,340 | 8,685 | 11,610 | 9,115 |
| % Change | 3 | 2 | 5 | 8 | 6 | -3 | 4 | 2 | 4 |
| All Land Averagec | |||||||||
| $/acre | 960 | 1,555 | 8,540 | 4,435 | 9,730 | 2,065 | 5,060 | 7,320 | 4,015 |
| % Change | 3 | 7 | 6 | 5 | 4 | 2 | 4 | 3 | 5 |
bValue of pivot not included in per acre value.
cWeighted averages.
| Type of Land | Agricultural Statistics District | |||||||
|---|---|---|---|---|---|---|---|---|
| Northwest | North | Northeast | Central | East | Southwest | South | Southeast | |
| ----------------------------------------- Dollars Per Acre ------------------------------------------ | ||||||||
| Dryland Cropland | ||||||||
| Average. . . . . . . . . . . . | 36 | 79 | 270 | 130 | 240 | 59 | 120 | 195 |
| % Change . . . . . . . . . . | -1 | 3 | 2 | -4 | -2 | 5 | 4 | -3 |
| High Third Quality. . . . . | 50 | 115 | 320 | 165 | 290 | 75 | 145 | 240 |
| Low Third Quality. . . . . | 26 | 53 | 210 | 98 | 195 | 43 | 93 | 155 |
| Gravity Irrigated Cropland | ||||||||
| Average. . . . . . . . . . . . | 135 | 200 | 330 | 265 | 320 | 190 | 270 | 285 |
| % Change . . . . . . . . . . | -7 | -5 | 5 | -2 | 5 | -3 | 4 | -2 |
| High Third Quality. . . . . | 175 | 235 | 385 | 315 | 355 | 230 | 310 | 325 |
| Low Third Quality. . . . . | 95 | 165 | 270 | 210 | 275 | 145 | 220 | 255 |
| Center Pivot Irrigated Croplandb | ||||||||
| Average. . . . . . . . . . . . | 185 | 245 | 370 | 290 | 355 | 220 | 320 | 340 |
| % Change . . . . . . . . . . | -3 | 2 | 1 | -5 | 3 | -5 | 2 | 1 |
| High Third Quality. . . . . | 235 | 275 | 420 | 355 | 405 | 265 | 360 | 390 |
| Low Third Quality. . . . . | 145 | 190 | 305 | 235 | 295 | 185 | 270 | 285 |
| Pasture | ||||||||
| Average. . . . . . . . . . . . | 16 | 37 | 75 | 49 | 65 | 28 | 44 | 61 |
| % Change . . . . . . . . . . | 9 | 11 | 5 | 8 | 7 | 10 | 6 | 9 |
| High Third Quality. . . . . | 22 | 52 | 98 | 63 | 78 | 38 | 56 | 73 |
| Low Third Quality. . . . . | 13 | 19 | 56 | 34 | 49 | 21 | 30 | 45 |
| ----------------------------------------- Dollars Per Month ------------------------------------------ | ||||||||
| Cow-Calf Pair Monthly Ratesc | ||||||||
| Average. . . . . . . . . . . . | 51.20 | 73.95 | 70.10 | 68.05 | 66.45 | 60.55 | 57.30 | 64.35 |
| % Change . . . . . . . . . . | 11 | 6 | 4 | 2 | 6 | 3 | 1 | 7 |
| High Third Quality. . . . . | 58.35 | 84.15 | 79.85 | 80.60 | 75.20 | 65.85 | 69.50 | 73.65 |
| Low Third Quality. . . . . | 43.80 | 61.45 | 57.10 | 55.35 | 54.95 | 52.40 | 48.15 | 50.45 |
bCash rents on center pivot land assumes landowners own total irrigation system.
cA cow-calf pair is typically considered to be 1.25 to 1.30 animal units (animal unit being 1,000 lb. animal) for a five month grazing season. However, this can vary depending on weight of cow and age of calf.
Jim Jansen, (402) 261-7572
Agricultural Economist
University of Nebraska-Lincoln
jjansen4@unl.edu
Jeffrey Stokes, (402) 472-2127
Professor of Agricultural Economics
University of Nebraska-Lincoln
jeffrey.stokes@unl.edu
References
Kauffman, N., & Kreitman, T. (2024, February 22). Steady Growth in Farmland Values Continues, retrieved March 5, 2024, from the Kansas City FED.
Lubben, B. (2023, October 2). Fall 2023 Nebraska Farm Income Outlook, retrieved March 6, 2024 from the UNL Bureau of Business Research.
Cowley, C., Mosley, J., & Kreitman, T. (2024, February 8). Farmland Values Remain Resilient, retrieved March 6, 2024, from the Kansas City FED.