Cornhusker Economics April 28, 2021
Is Nebraska Farmland a Good Investment?
Economists analyze the performance of financial investments in a variety of ways. Probably the most significant analysis undertaken is the quantification of the tradeoff between risk and return. While individuals are generally thought to prefer investments offering higher returns, they also prefer to not be exposed to excessive risk. And because higher returns are generally associated with higher risk, investors tend to choose investments that are consistent with their specific risk/return goals. In this article, Nebraska farmland (dryland, irrigated, and grazing) is analyzed from the perspective of its investment potential by quantifying the risk/return tradeoff.
Most investments offer two types of return. First, there is the return from holding the investment in a portfolio where increases (decreases) in the value of the investment are referred to as capital gains (losses). A share of common stock, for example, purchased at $100/share offers a capital gain of 10% if at some future point in time, the value per share increases to $110. In this simple example, we ignore any fees associated with buying or selling the stock and in addition, ignore the amount of time that has elapsed between the two valuation points. This sort of return is often referred to as a “paper gain” since it is a gain on paper only unless the stock is actually sold at $110/share.
The second source of return is the dividend that the stock pays. Not all stocks pay dividends, but when they do, the dividend amount expressed relative to the value of the stock results in what is referred to as a “dividend yield”. For example, the company with the stock from the previous example may declare a dividend of $2/share implying that the dividend yield is $2/$100 = 2% and that the total return on the stock is 12% (2% dividend yield plus 10% capital gain).
Most any investment’s returns can be calculated similarly, and an investment in farmland is no different. For example, a purchaser of farmland pays a certain $/acre analogous to the $/share a stock purchaser pays. If the value of the farmland increases, there is an unrealized capital gain (paper gain), as well as a flow of income much like a declared dividend. This flow of income may be the net income the owner receives from farming the land or lease income for renting it out to someone else who farms it.
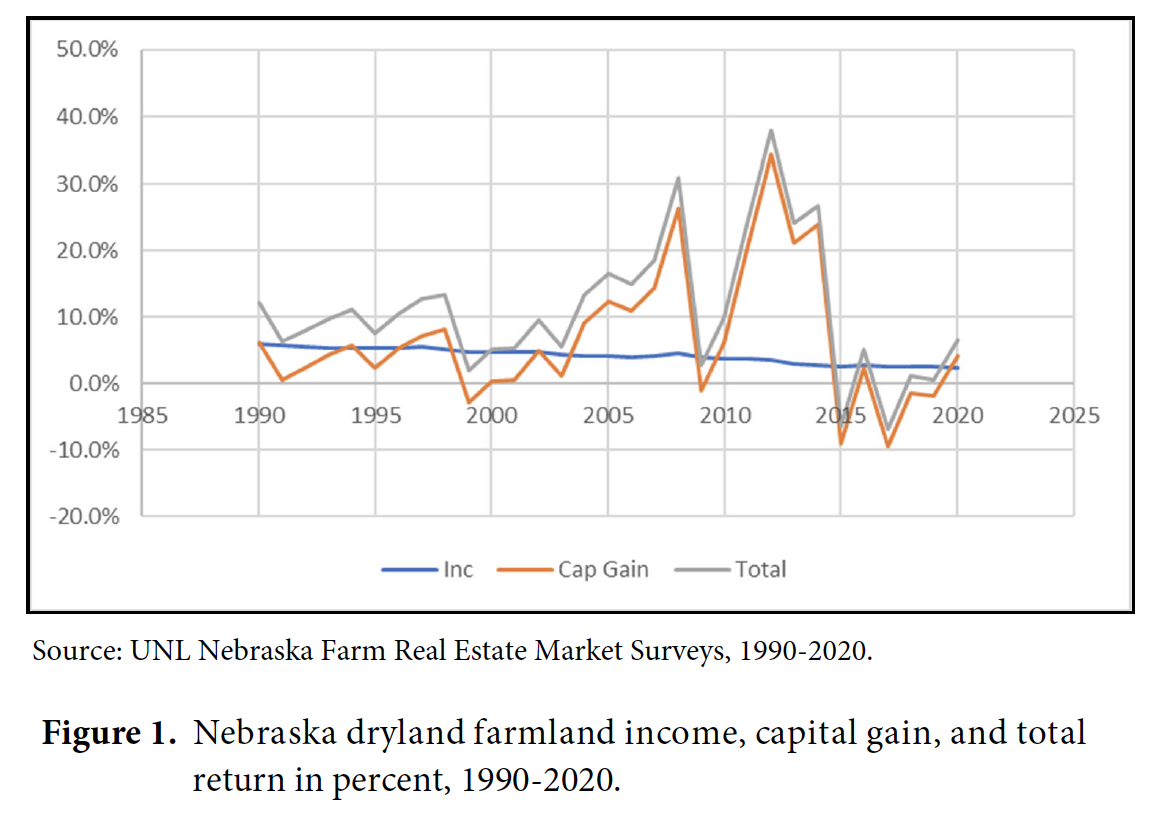
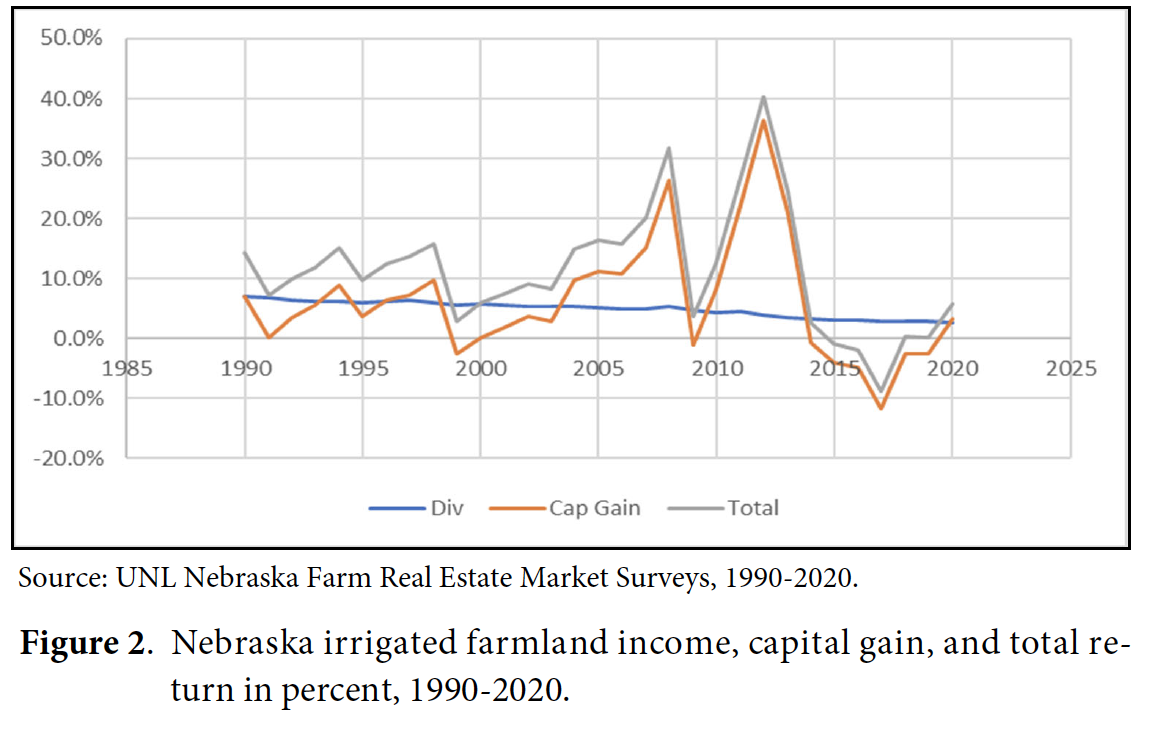
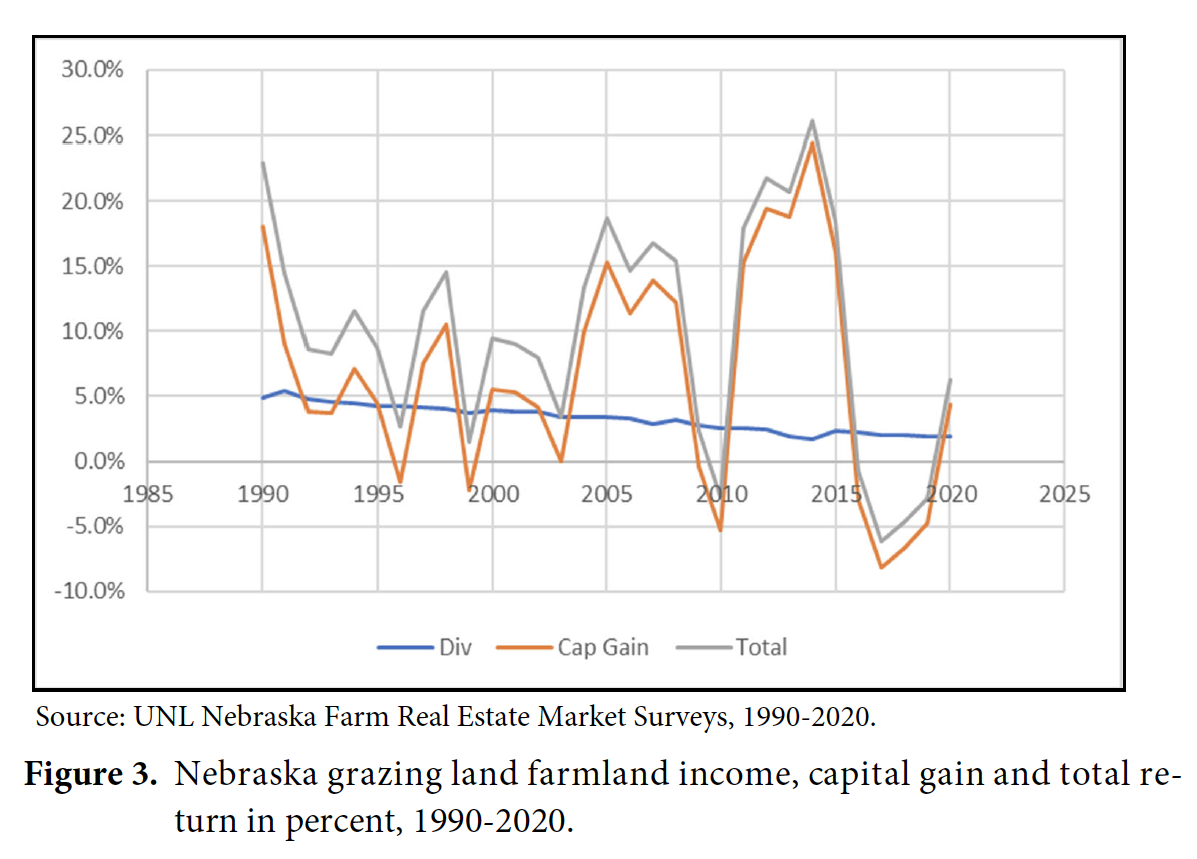
Shown in Figures 1-3 are the annual state average percentage returns for dryland (Figure 1), irrigated (center pivot) farmland (Figure 2) and grazing land (nontillable) (Figure 3) in Nebraska since 1990. All three figures show the same thing for Nebraska farmland: (1) farmland income relative to farmland value (i.e., the dividend yield) is stable but declines over time, and (2) farmland capital gains and hence total farmland returns are significantly more volatile than income relative to farmland value. Just looking at the figures, it may also be possible to make the case that the volatility in the capital gain percentage has increased over time. These observations are born out in Table 1 where the mean and standard deviation of annual income, capital gain, and total return percentage for the three types of Nebraska farmland are reported.
The statistics in Table 1 speak to the risk/return tradeoff discussed above and inherent in all investments. It should be noted that there are numerous ways to quantify the risk in an investment including but not limited to variance, standard deviation, and Beta[1]. Standard deviation is used here since it has the advantage of being in the same units as return (i.e., percentage). Not surprisingly, total returns are highest for irrigated farmland (11.23%) followed by dryland (10.92%), and then grazing land (10.00%). In terms of risk, the standard deviation is highest for irrigated farmland (10.24%), dryland (10.02%), and grazing land (8.61%). In general, the capital gain volatility for each type of farmland is a significant multiple of the income volatility. For example, capital gain standard deviation is 9 times that of income standard deviation for dryland (10.00%/1.11% = 9.01). These multiples highlight the capital gain risk relative to the income risk for each farmland type. Clearly, the volatility in total farmland returns emanates principally from the capital gain return.
So, how does an investment in Nebraska farmland compare to other investments? An investment in the S&P 500 over the same length of time as the farmland data suggests an average annual return of 10.59% which is pretty consistent with Nebraska farmland of all types (see Table 1). However, the risk in the S&P 500, as measured by the standard deviation of annual returns over the same length of time is about 16.69%. This implies that stock market returns, on average, are more volatile than Nebraska farmland. The standard deviation multiples are 1.67 (dryland), 1.63 (irrigated farmland), and 1.94 (grazing land). Perhaps this is why Bill Gates (Burbach 2021) and Ted Turner (Hammel 2018) are Nebraska’s largest farmland owners: similar returns to the stock market, but less risk.
References
University of Nebraska–Lincoln. Nebraska Farm Real Estate Market Highlights Survey and Report. Nebraska Farm Real Estate Market Developments Highlights 1990-2020.
Hammel, P. (2018, December 3). Ted Turner purchases more grazing land in Nebraska. Omaha World Herald.
Burbach, C. (2021, January 25). Bill Gates' 20,000 acres in Nebraska help make him the top farmland owner in the U.S. Omaha World Herald.
Click on images to enlarge figures.
| Table 1. Mean and standard deviation of income, capital gain, and total return for Nebraska dryland, irrigated farmland, and grazing land, 1990-2020. | ||||||
|---|---|---|---|---|---|---|
| Dryland | Irrigated | Grazing | ||||
| Mean | Std Dev | Mean | Std Dev | Mean | Std Dev | |
| Income | 4.17% | 1.11% | 4.91% | 1.34% | 3.29% | 1.04% |
| Cap Gain | 6.75% | 10.00% | 6.32% | 9.95% | 6.71% | 8.52% |
| Total | 10.92% | 10.02% | 11.23% | 10.24% | 10.00% | 8.61% |
[1] Beta is a measure of the systematic risk of a security compared to the market as a whole with larger values consistent with more risky securities. Betas for Nebraska farmland were estimated for this study to be about -0.114 (dryland), -0.122 (irrigated farmland) and -0.088 (grazing land) on average over the 1990 to 2020 period. For comparison, the 5 year monthly average Beta for John Deere common stock is 1.07. The fact that Nebraska farmland has a negative beta implies significantly less risk than the stock market and a rare investment whose correlation with the stock market is negative.
Hanson-Clegg-Allen Endowed Chair Agricultural Banking and Finance
Department of Agricultural Economics
University of Nebraska-Lincoln
jeffrey.stokes@unl.edu
(402) 472-1742
Agricutural "Economist
University of Nebraska-Lincoln
jjansen4@unl.edu
(402) 261-7572
Graduate Student
Department of Agricultural Economics
University of Nebraska-Lincoln