Cornhusker Economics Aug 9, 2023
ASSESSING DETERMINANTS OF PARTICIPATION IN CONSERVATION PROGRAMS IN THE U.S.
INTRODUCTION
In order to generate ecosystem services (ES) from privately owned intensively managed agricultural land, the United States Department of Agriculture (USDA)’s Farm Service Agency (FSA) and Natural Resources Conservation Service (NRCS) have implemented many conservation programs such as the Conservation Reserve Program (CRP), Conservation Stewardship Program (CSP), and Environmental Quality Incentives Program (EQIP), to name a few. These programs provide financial and technical assistance to farmers and ranchers to adopt land management practices that generate ES.
USDA allocated a budget of $2.1 billion and $1.75 billion for CRP and EQIP in 2020 respectively (USDA/Budget Summary, 2020). The total number of contracts enrolled in CRP was 105,159 in Iowa, 33,609 in Kansas, and 18,405 in Nebraska in September 2020 (CRP/FSA, 2020). Likewise, the total number of contracts enrolled in CSP was 370 in Iowa, 692 in Kansas, and 422 in Nebraska and for EQIP the numbers were 986 in Iowa, 942 in Kansas, and 884 in Nebraska (NRCS, 2020).
Given these statistics, in this study, we were interested in understanding the drivers of conservation program participation. We are interested in this issue since participation in conservation programs is a complex decision driven by factors dependent upon the nature of the operation as well as the attributes of the operator. For example, current farming practices, the size of the farms, operator education level, and income from farming are associated with the willingness to participate in conservation programs (Gladkikh et al., 2020; Gyawali et al., 2003; Wang et al., 2021). Additionally, Dessart et al., (2019) have emphasized the role of behavioral factors in influencing producers' adoption of sustainable land use practices. Wang et al., (2019) suggested incorporating farmers’ attitudes and their understanding of conservation practices to assess their conservation behavior. Similarly, Gladkikh et al., (2020) suggested exploring environmental attitudes in future research. Yet limited attention has been paid to the ways in which participation in one program impacts participation in the others as well as the impact of personality of the producer on their likelihood of participation. Also, there is limited understanding of how past program participation impacts current participation rates. Given this background, for this research, we focused on a unique data set collected from row-crop producers in Iowa, Kansas, and Nebraska in 2021 to study the participation decision.
DATA AND METHODS
The total sample of 5499 row-crop farmers from counties of the above-mentioned states was generated through stratified random sampling from the Farm Market iD database. For each of the three states, 611 addresses were drawn for operations with sizes less than 250 acres, between 250 and 749 acres, and operations greater than 750 acres, generating the total sample size who were reached with the survey instrument.
The survey questionnaire was designed in consultation with the Bureau of Sociological Research at the University of Nebraska-Lincoln. The survey included questions related to farmer attitudes toward participation in conservation programs, environmental protection, reasons behind their participation or non-participation in conservation programs, whether they have crop insurance or not, their socio-demographic characteristics, and so on.
We categorized our variables of interest into four groups: participation, personality trait variables, attitudinal, and non-attitudinal variables. Participation variables were defined for each of the three programs taking a value of 1 if the respondent currently participates in a program and 0 otherwise. The personality traits are those characteristics of an individual that are determined by their beliefs, upbringing, and behavior. Scientists have categorized these characteristics of individuals into five types of traits which are commonly called the Big Five personality traits. Under the umbrella of the Big Five traits rest traits like openness, conscientiousness, extraversion, agreeableness, and neuroticism (Herzberg & Brähler, 2006; Liem & Martin, 2015; Milfont & Sibley, 2012). For example, conscientiousness refers to the ability of people to be well organized, diligent, and plan well. Again openness refers to the tendency of people to seek out new experiences or be open to changes (Herzberg & Brähler, 2006; Liem & Martin, 2015; Milfont & Sibley, 2012).
We captured the conscientiousness dimension of the respondent as it related to conservation program participation by asking respondents, to report to what degree the statement “I take a lot of time and care in preparing my conservation contract application” describes them. Likewise, openness was captured by asking them how much the statement “I like to experiment with new conservation land management practices to reduce the costs to my operation” describes them. They had 4 scales “A lot”, “Somewhat”, “A little”, and “Not at all” to choose from with “A lot” represented by a 4 in the analysis and “Not at all” as a 1.
To assess individual attitudes, we asked respondents whether “Increase in current commodity prices”, “Cost savings and other benefits generated from participation in conservation programs” and “Presence of farm successors” have positive, negative, or no influence on their decision to participate in conservation programs.
For two additional attitudinal variables related to environmental and risk attitudes respectively, we asked them how much the statements “I like to experiment with new conservation land management practices in my operation to benefit the local environment” and the statement “I am willing to take risks related to my operation to increase my operation’s profitability” describes them. The responses to these questions varied on a 4-point scale represented by “A lot”, “Somewhat”, “A little”, and “Not at all” where “A lot” represented a 4 in the analysis and “Not at all” was a 1.
Non-attitudinal variables included in the survey are the respondent’s age, and total owned land and and total rented land in the operation. Additionally, information on the level of education, annual gross income, percent of income from the farm, and whether farming is the only source of income or not, was also collected. The level of education was divided into three categories - low, mid, and high levels. If the level of education was less than or equal to a high school degree or GED, then it was categorized as low level of education. Likewise, if the level of education was equal to an associate degree and/or technical training, it was categorized as mid-level of education, and finally, if the level of education was equal to or higher than a bachelor’s degree, then it was categorized as a high level of education.
The household’s annual gross income was similarly categorized into three categories. If the annual gross income was equal to or less than $74,999, then we categorized it as low-income level, if it was equal to the range of $75,000 to $124,999, then it was categorized as mid-level income, likewise, if it was equal to the range of $125,000 to $150,000 or above, then it was categorized as high income. In the survey, we also asked what percentage of respondents’ income comes from farming and gave them options of choosing from 5 categories such as 1-19%, 20-39%, 40-59%, 60-79%, and 80-99%. If the percentage of the income from the farm was equal to or more than 60%, then the variable took a value of 1 and 0 otherwise. Finally, we asked respondents whether their household had sources of income other than from farming. This variable took a value of 1 for those respondents who answered No to this question and 0 otherwise. Table 1 includes the summary statistics of all key variables.
Table 1: Summary Statistics of Key Variables
| Variables | Mean | Standard Deviation | Median | Number of Observations |
|---|---|---|---|---|
| Total owned land (Acres) | 594.46 | 653.91 | 400 | 855 |
| Total rented land (Acres) | 603.19 | 799.52 | 310 | 855 |
| Age (Years) | 66.33 | 9.47 | 66 | 799 |
| Crop insurance | 0.872 | 0.33 | 1 | 831 |
| (Yes =1, No =0) | ||||
| High level of education-categories | 3.07 | 1.04 | 3 | 807 |
| 1. Less than high school | ||||
| 2. High school degree or GED | ||||
| 3. Associate degree and/or technical training | ||||
| 4. Bachelor’s degree | ||||
| 5. Graduate degree | ||||
| Gross annual income-categories | 4.12 | 1.7 | 4 | 680 |
| 1. Less than $50,000 | ||||
| 2. $50,000 to $74,999 | ||||
| 3. $75,000 to $99,999 | ||||
| 4. $100,000 to $124,999 | ||||
| 5. $125,000 to $149,999 | ||||
| 6. $150,000 and above | ||||
| Income from farming-categories | 3.29 | 1.4 | 3 | 556 |
| 1. 1-19% | ||||
| 2. 20-39% | ||||
| 3. 40-59% | ||||
| 4. 60-79% | ||||
| 5. 80-99% | ||||
| Income source other than farming | 0.29 | 0.45 | 0 | 771 |
| (No=1, Yes=0) | ||||
| Influence of “increase in current commodity prices” on decision to participate- categories. | 2.24 | 0.88 | 2 | 744 |
| 1. Negative influence | ||||
| 2. No influence | ||||
| 3. Positive influence | ||||
| 4. Not applicable | ||||
| Influence of “cost savings and other benefits generated for the operation from participation in Conservation Programs” on decision to participate-categories. | 2.63 | 0.69 | 3 | 736 |
| 1. Negative influence | ||||
| 2. No influence | ||||
| 3. Positive influence | ||||
| 4. Not applicable | ||||
| Influence of “having younger family or non-family members who will be managing the operation after me” on decision to participate-categories. | 2.56 | 0.82 | 2 | 781 |
| 1. Negative influence | ||||
| 2. No influence | ||||
| 3. Positive influence | ||||
| 4. Not applicable | ||||
| Description of the statement “I like to experiment with new conservation land management practices to reduce the costs to my operation.” | 2.46 | 0.92 | 2 | 781 |
| 1. A lot | ||||
| 2. Somewhat | ||||
| 3. A little | ||||
| 4. Not at all | ||||
| Description of the statement “I like to experiment with new conservation land management practices on my operation to benefit the local environment.” | 2.57 | 0.92 | 3 | 768 |
| 1. A lot | ||||
| 2. Somewhat | ||||
| 3. A little | ||||
| 4. Not at all | ||||
| Description of the statement “I take a lot of time and care in preparing my conservation contract application.” | 2.74 | 1.02 | 3 | 748 |
| 1. A lot | ||||
| 2. Somewhat | ||||
| 3. A little | ||||
| 4. Not at all | ||||
| Description of the statement “I am willing to take risks related to my operation to increase my operation’s profitability.” | 2.34 | 0.79 | 2 | 754 |
| 1. A lot | ||||
| 2. Somewhat | ||||
| 3. A little | ||||
| 4. Not at all |
The distribution of past and current participation of respondents in conservation programs varies from one conservation program to another and from one state to another as presented in Figures 1, 2, and 3:
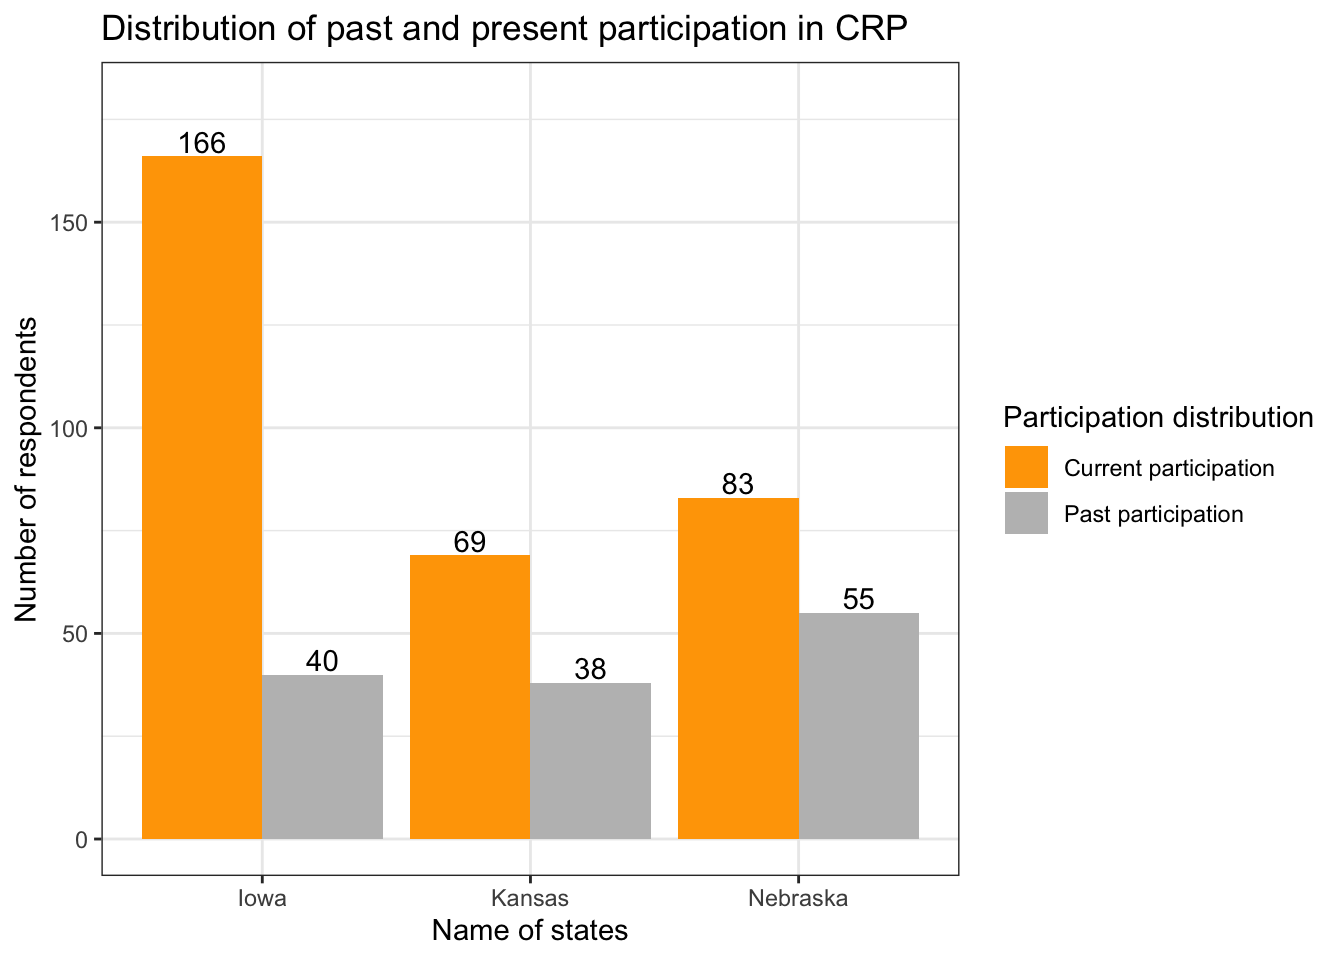
Figure 1: Histogram showing current and past participation in Conservation Reserve Program

Figure 2: Histogram showing current and past participation in Conservation Stewardship Program
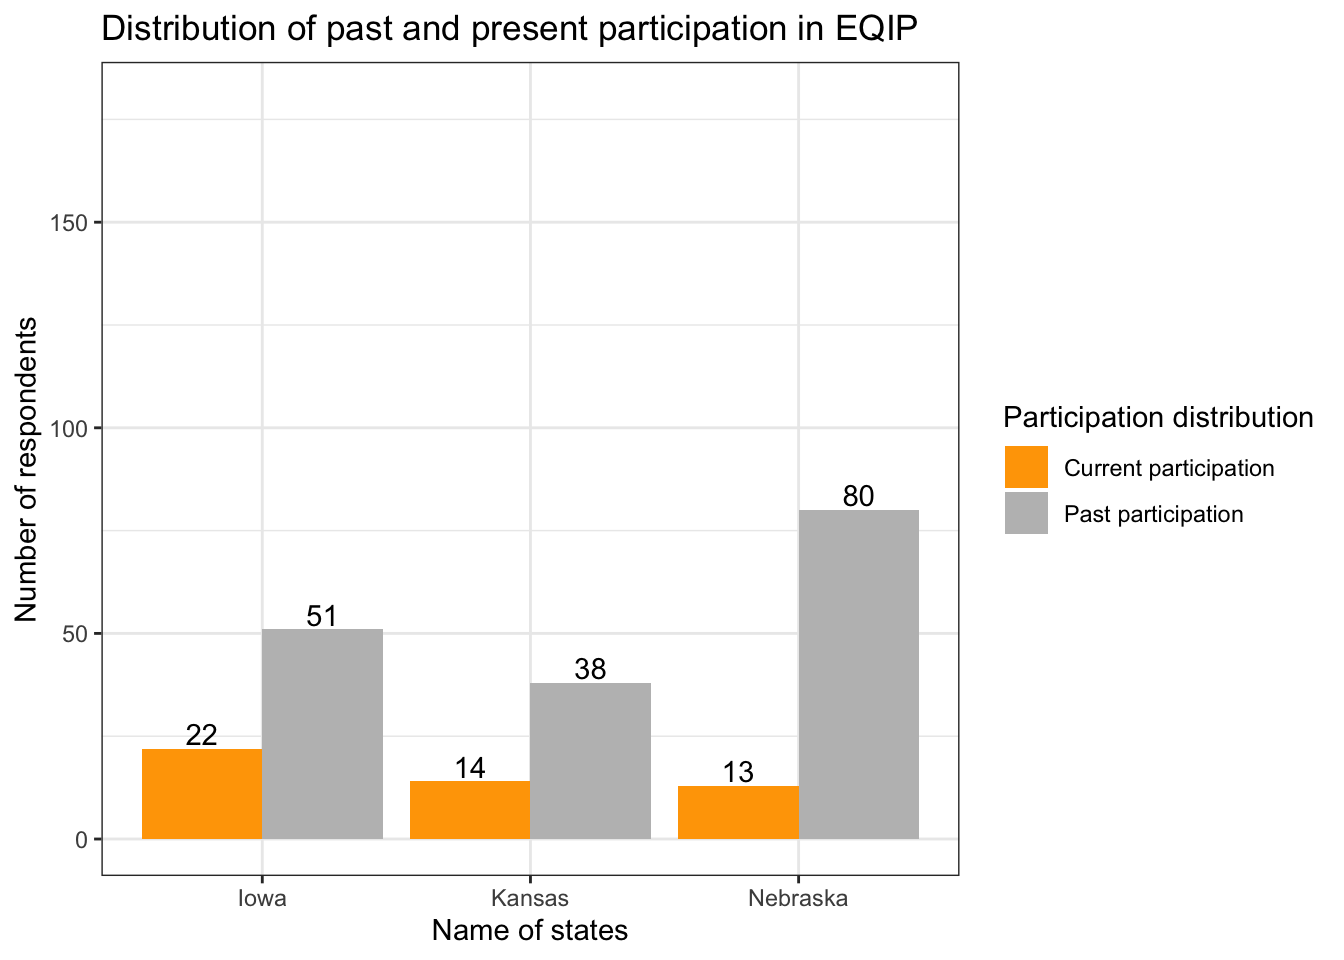
Figure 3: Histogram showing current and past participation in Environmental Quality Incentives Program
RESULTS:
Information in Figures 1,2, and 3 provides some key insights about differences in participation by program. Considering the CRP which is the oldest and a land retirement program, the total current enrollment is highest in Iowa followed by Nebraska although Nebraska enrollment numbers don’t seem to be very different from those for Kansas. Participation in the CSP from Figure 2 seems to be the same in all states and much lower than for CRP which may be attributed to the performance-based nature of the CSP which is a newer and a working lands program. Participation in the EQIP is the lowest, which may be attributed to its unfamiliarity with the survey respondents although this is not a new program. Interestingly, past participation was higher than current participation in both the CSP and EQIP suggesting the historical familiarity with the CRP and participation in it, which both CSP and EQIP cannot match. Finally, in terms of cross state comparisons, given the nature of our responses, current program participation is highest in Iowa than in the other two states.
Next, focusing on data in the table, we obtain some key insights. The median respondent age in the sample is 66 years which is not surprising given the overall older population of operators in the U.S. The median and average values for owned and rented acreage also show that our data is positively skewed towards large operations. In terms of education, most respondents have an associate degree and/or technical training and a median income that falls in the range of $100,000 to $124,999 annually with the average value being higher. Finally, for most respondents, farming is the main source of income with them deriving upwards of 40% of their total income from farming.
Moving to attitudinal variables, we find that increase in commodity prices have no influence on program participation as represented by a median value of 2 although the average value is 2.24 indicating a positive influence for some individuals. Cost savings on the other hand have a positive influence on participation at a median value of 3 with an average of 2.63. The presence of a farm successor also seems to have no influence per the median value although the average is 2.56 meaning that some respondents did note a positive influence when responding to this question.
In terms of personality traits, we find that the average respondent is at least a little if not more open to trying out new things on their operation as reflected by a median value of 2 and average value of 2.46 for the question measuring openness. They are also quite conscientious in how they approach the conservation contract application as represented by the average value of 2.74 and median value of 3. Next, in terms of risk attitudes we find that respondents on average are risk taking when it comes to increasing their operation’s profitability. The median value is 2 representing somewhat risk taking with the average being 2.34. Finally, the respondents are for the most part environmentally motivated and are willing to participate in programs to benefit their local environment as reflected by the average value of 2.57 which is close to the median of 3.
CONCLUSION
A descriptive analysis of our data provides some key insights about conservation program participation in the mid-west and key producer characteristics which have been identified in the past literature as relevant to the participation decision. As part of future research, we want to conduct systematic regression analysis to identify the factors that can explain the variation in participation rates across programs by the three states. The results of that analysis will provide a detailed understanding of the factors that influence farmer behavior and identify policy levers that agencies can deploy to positively influence farmer engagement and interest and eventual participation in these programs that are key to generation of ecosystem benefits from agricultural landscapes.
Acknowledgment: Funding for this project came from USDA NIFA Grant#2016-67023-24642. Survey implementation support was provided by the Bureau of Sociological Research at UNL.
REFERENCES:
CRP/FSA (2020). Conservation Reserve Program. Annual Summary and Enrollment Statistics. FY2020. https://www.fsa.usda.gov/Assets/USDA-FSA Public/usdafiles/Conservation/PDF/Annual%20Summary%202020.pdf
EQIP. (2019). Environmental Quality Incentives Program. National Sustainable Agriculture Coalition.https://sustainableagriculture.net/publications/grassrootsguide/conservation-environment/environmental-quality-incentives-program/
Herzberg, P. Y., & Brähler, E. (2006). Assessing the Big-Five Personality Domains via Short Forms. European Journal of Psychological Assessment, 22(3), 139–148. https://doi.org/10.1027/1015-5759.22.3.139
Liem, G. A. D., & Martin, A. J. (2015). Young people’s responses to environmental issues: Exploring the roles of adaptability and personality. Personality and Individual Differences, 79, 91–97. https://doi.org/10.1016/j.paid.2015.02.003
Milfont, T. L., & Sibley, C. G. (2012). The big five personality traits and environmental engagement: Associations at the individual and societal level. Journal of Environmental Psychology, 32(2), 187–195. https://doi.org/10.1016/j.jenvp.2011.12.006
NRCS (2020). https://www.farmers.gov/data/financial-assistance-download
USDA (2020). Fiscal year 2020 Budget Summary. https://www.usda.gov/sites/default/files/documents/fy2020-budget-summary.pdf
Manita Ale
Graduate Student
Department of Agricultural Economics
University of Nebraska–Lincoln
Simanti Banerjee
Associate Professor
Department of Agricultural Economics
University of Nebraska–Lincoln
simanti.banerjee@unl.edu
Taro Mieno
Associate Professor
Department of Agricultural Economics
University of Nebraska-Lincoln
Karina Schoengold
Professor
Department of Agricultural Economics
University of Nebraska-Lincoln