Cornhusker Economics April 24, 2024
Buying Revenue Protection (RP) Versus Buying the RP with Harvest Price Exclusion (RPHPE) Version of Multi-Peril Crop Insurance
By Matt Stockton and Shannon Sand
In a conversation with one of the TAPS participants about Multi-Peril Crop Insurance (MPCI) he suggested that you would never recommend RPHPE, due to the risk associated with a higher fall harvest price compared to the spring or predicted price. Since the year 2000, this has occurred about one-third of the time. This price reversal may alter indemnity size considerably, depending on which insurance is selected and if one qualifies for an indemnity. The discussion with the TAPS participant focused on the concern of risk exposure from pre-selling uninsured grain due to an unexpected increase in harvest price. This relates directly to the difference between RP and RPHPE. To better understand how this might work and the magnitude of its impact, some simple scenarios and simulations will be applied. It is helpful to understand the basics about these two types of revenue protection insurances. The hope is that it is not overly repetitive and simple.
On average RP insurance is about 70% more expensive than RPHPE for optional units and 65% more for enterprise units. This exercise and discussion focus on enterprise units with 65% to 85% coverage levels. Coverage level is determined by a revenue calculation. For instance, an RP policy at the 85% level would be based on 85% of APH, times the highest average harvest or predicted price. In the simulation, the APH’s for each year is the actual average of the previous 10 years. For the area farmed by the University this ranged from a low of 169.3 bushels per acre (bpa) (2020, 2021) to a high of 199.4 bpa (2009), with the most recent 2024 of 173.3 bpa.
The key difference between RP and the HPE version of RP is how indemnities are calculated. RP insurances are insurance that is based on a minimum revenue amount. If one buys an 85% RP plan for a corn enterprise where the APH is 200 bpa they are guaranteed 170 bpa times the average February or October December futures price, whichever turns out to be higher. Using the predicted price for 2022, the December average future price in February 2022, was $5.90/bu and October’s average price was $6.86/bu making the guaranteed revenue for RP, $6.86 times 170 bu/acre or $1,166.20/acre. In the case of RPHPE the February price would be used, and its guaranteed revenue would be lower, $5.90 times 170 bpa or $1,003.00/acre. Had the February price been the greater of the two values both policies would guarantee the same revenue.
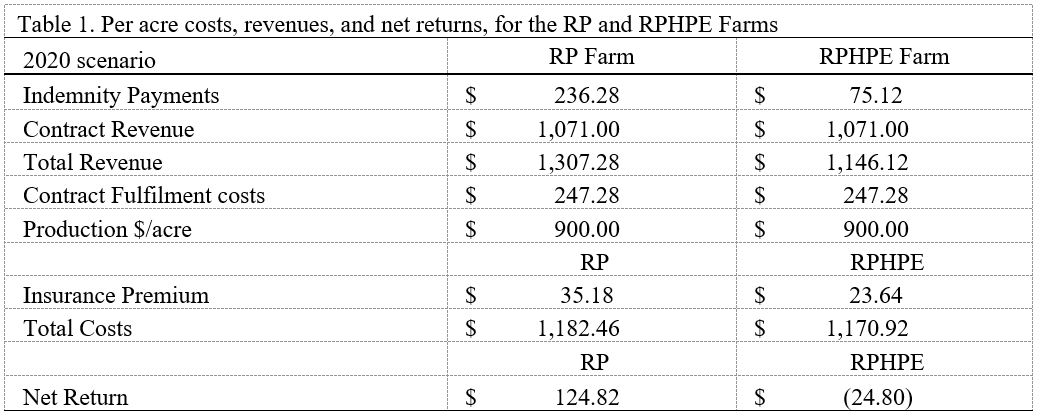
In the process of considering the concerns of this TAPS participant the following scenario was developed to recreate the circumstances that reflect it. Suppose two producers each purchase an 85% RP policy, one without HPE and the other with. Each policy is bought in enterprise units for 1,500 acres of corn. For our purposes the insured areas are identical and are located in central Nebraska. The average production history (APH) for both farms is 240 bpa. The predicted price, average value of December corn futures for the month of February in 2021 was $4.58/bushel (bu). During the months of April through August the growers both use forward contracts and pre harvest sales to price 85% of their APH, 204 bpa or 306,000 bu of corn. Each sell for an average value of $5.25/bu. In both cases the farmers believe they are completely covered by crop insurance and expect to have at least $1,606,500 in gross revenue. This amount averages $1,071/acre. Unfortunately, in late August a series of local weather events reduced average yields to 160 bpa giving each of the farms a 44 bpa deficit. At the end of the season, prior to actual harvest, USDA announces the harvest price (average value of the December corn contract for the month of October) as $5.37/bu. At the time of the contract delivery, the basis at the local elevator was $-0.26/bu with the listed futures price of $5.78/bu. This makes the elevator's cash price $5.52/bu. This value is used to purchase any needed grain to fulfill contract shortages. An additional $0.10/bu is paid as a transfer fee. Table 1 captures the income effects of the two different RP policies. It shows that RP resulted in more than a $149.62 higher net return versus the RPHPE option. Further investigation shows that the $149.62 difference was only for yields less than 174 bpa. For yields greater than 173 bpa RPHPE acted as an RP with 72% coverage level. From 174 bu/acre to 201 bu/acre RPHPE indemnities increased relative to the RP indemnities. RPHPE payouts increased at $5.37 for each additional bushel of production. The harvest price increase in 2021 from spring to fall was about $0.79/bu. In 2022 the harvest price increase reached nearly a dollar at about $0.96/bu. The 2022 results show that the larger increase in harvest price increased the gap in net returns between RP and RPHPE. In 2022 the indemnity gap was $184.31 per acre. The higher prices also resulted in a larger effective percentage of coverage for RPHPE versus the 2021 crop year. It effectually became a 73% RP plan whereas the 2021 RPHPE was effectually a 72% RP policy.
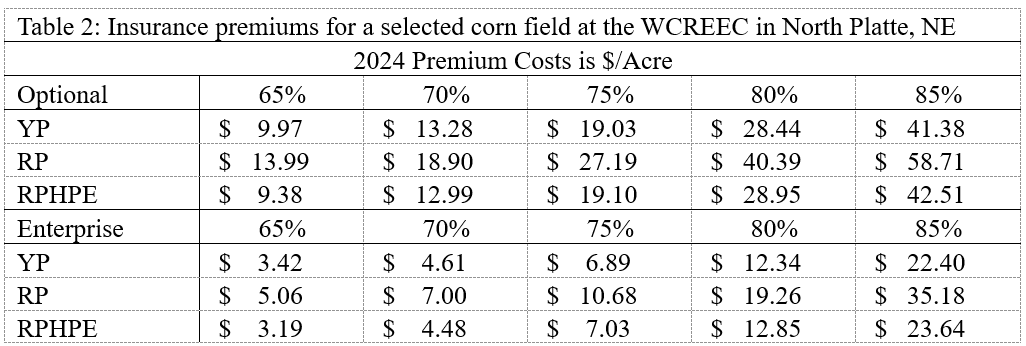
In this short scenario and brief comparison between RP and its HPE version it has been seen there are some significant differences when harvest price exceeds predicted price. This of course is expected since this is the way these policies were designed. What is also expected is that for those years when harvest price is equal to or less than the predicted price both insurances perform identically. Since the year 2000 about two-thirds of the time predicted price exceeded harvest price. Of the eight instances where harvest price was more than predicted price, half had an average value of less than $0.27/bu in excess. The other half of these prices averaged more than a $1.00/bu above predicted prices. Given the frequency of the price reversals and their magnitude it makes one wonder how these different insurance types perform in the real world. How have they paid out versus their cost? This is exactly what we did using data from the West Central Research and Extension Education Center (WCREEC) in North Platte, historical predicted and harvest prices from 2004 to 2023 found in the USDA annual outlook published in February of each year. The resulting indemnities were compared to the current MPCI premiums obtained from a local insurer for the selected study area and compared. A sample of these premiums are listed in Table 2.
The simulated indemnities along with their frequencies and various other calculations are listed in Table 3. During the time represented (2004 to 2023) harvest price exceeded predicted price seven times: 2006, 2010, 2011, 2012, 2020, 2021, and 2022.
Of these seven reversal years, only 2012 qualified for an indemnity. Of the eight years where an indemnity was paid: 2004, 2005, 2007, 2012, 2013, 2014, 2016, and 2023, RP and RPHPE had identical payouts except for as expected in 2012. The lowest coverage level was at the 65% level, which occurred in 2013 for both RP and RPHPE. The indemnity for both was $34.69/acre. From the row titled “Totals” (6th from the bottom of the table) potential indemnities are summed by type and level. RP policies at the 85% level would have potentially paid out $945.72/ac from 8 different indemnities, $634.39/ac from 6 different indemnities at the 80% level, $199.50/ac from 4 different indemnities at the 75% level,
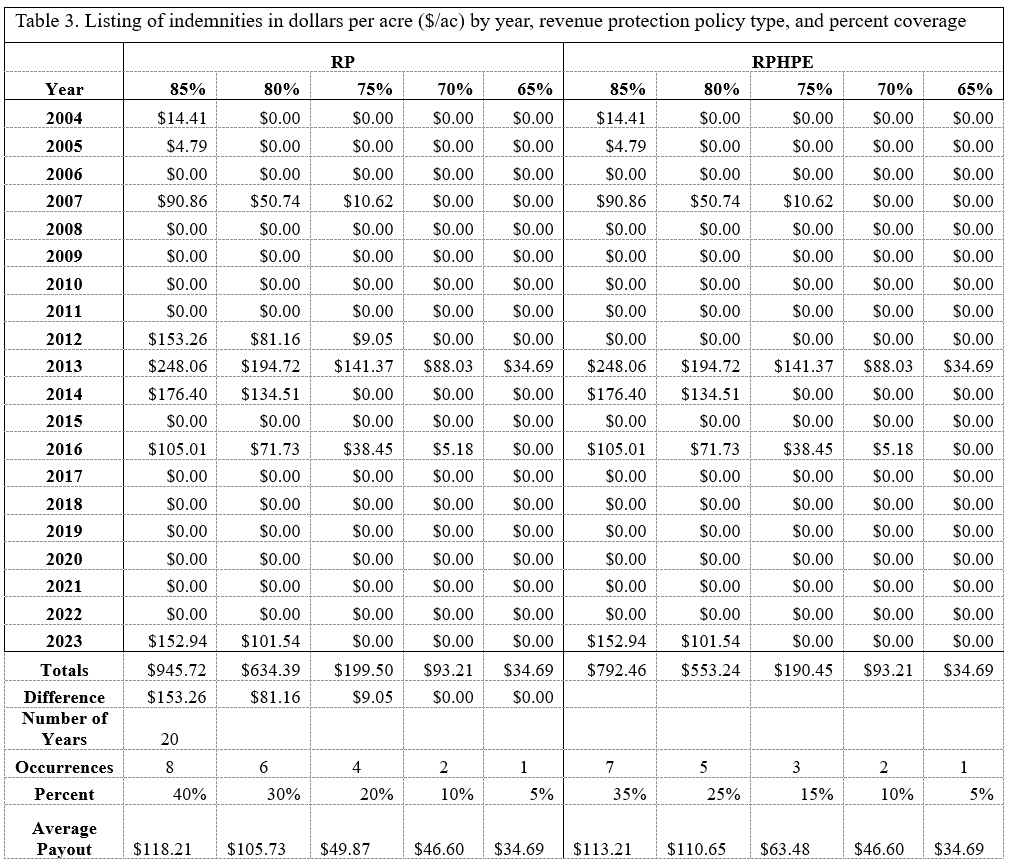
$93.21 from 2 different indemnities at the 70% level, and $34.69/ac from a single indemnity at the 65% level. Totals paid out for RPHPE policies were less, potentially being $764.46/ac with 7 different indemnities at the 85% level, $553.24/ac from 5 different indemnities at the 80% level, $190.45/ac with 3 different indemnities at the 75% level, $93.21with 2 different indemnities at the 70% level, and $34.69/ac again with a single indemnity at the 65% level. As expected, the higher coverage levels paid more frequently and at higher amounts. The average indemnity amount paid out based on the number of indemnities paid by policy type and coverage level are listed at the bottom of Table 3.
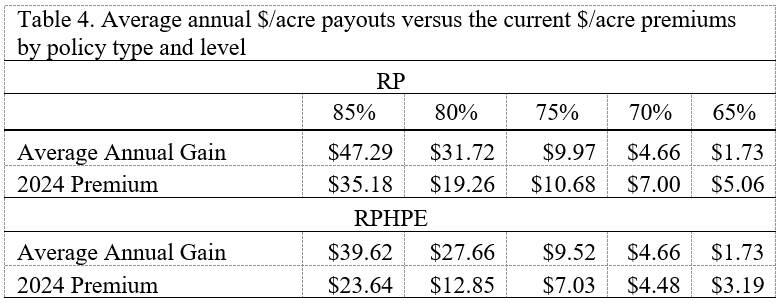
Table 4 lists the average annual payouts, which includes all years, for RP and RPHPE at the five applicable levels of coverage and the associated 2024 annual premium. In this result the RP policy's average annual indemnity exceeds the premium cost at the 80 and 85% levels by more than $12/acre. Whereas the 65, 70, and 75% levels did not cover the current cost by an average of more than $2/acre. The RPHPE has a larger difference between the annual gain and the premium costs for all levels of coverage. This is due mostly to the lower costs of the premiums. Only the 65% level of coverage premium for RPHPE exceeded the annual gain. Despite the promise of higher indemnities RPHPE on average has outperformed RP in the past 20 years for the selected area at WCREEC.
This brief and limited foray into RP and RPHPE difference provides some key insights into making a choice among them. For example, if I were buying insurance for the WRCEEC, I would recognize that in the most recent past the 80% and 85% levels are more likely to have an indemnity, and that indemnity is on average much higher. For the WCREEC example, the lower levels of insurance haven’t historically broken even for RP and RPHPE. The occurrence of years when harvest price exceeds predicted price are also associated with much higher prices and are part of an upward price trend. It is important to search for ways to more accurately forecast when harvest price is likely to be higher than the predicted price. This will require further study into related topics such as the fundamentals of the associated markets. For instance, I would find it difficult to purchase RP over RPHPE if I were confident harvest price in the coming year was going to be lower than the predicted price. There are those who may have a higher tolerance for risk which given the results here would likely be so inclined to use RPHPE except when they were reasonably sure of a higher harvest price. There is also the possibility that RPHPE at a higher level would cost similar to RP at a lower level of coverage. From Table 4 buying RPHPE at the 85% level is $4.38/acre more than buying RP at 80% with a 67% probability that it will be effective at the 85% level. Another possible swaying set of factors is that even if there is a higher harvest price given a steady market it is likely to be a small difference, which would minimize the effect on RPHPE. Knowing and understanding the possible effects of a higher harvest price on RPHPE coverage it is important to consider what the magnitude of the difference does to indemnities. On the flip side, RP is positively affected by a higher harvest price. In 2012 the higher harvest price effectually made the 85% coverage RP policy equivalent of having 112% production covered at the predicted price of $5.67/bu. The hope is that everyone will recognize their unique circumstances, varying tolerances of risk, and understanding of costs and make the best decision for themselves. Some possible questions to ask yourself when making this insurance decision: Why am I buying this particular insurance? What do I expect from the insurance I buy? Am I really considering the important factors of my situation in making this choice? Through my years in extension, I have heard some interesting stories about how insurance is selected. I have heard that there are those who focus on the subsidy level as the primary criteria for buying a specific policy. Of course, there is nothing wrong with this if you care little about the specific needs of your business. For example, covering costs is important to stay financially solvent. If you buy RP at the 50% level and have a yield loss of 51%, the indemnity will gain you 1% APH times the predicted or harvest price. With a 200 APH 1% is 2 bpa. If harvest price is high, at $5.50/bu, the indemnity will be $11/acre. How much does that $11/ac help in covering costs? At a $700/acre cost, given that you sell the crop at $5/bu, 98 bpa leads to a revenue of $490/acre plus the $11/acre indemnity making a total of $501/acre revenue. This is $199 short of breaking even. An RP 70% coverage policy would return $699/acre and add a few dollars to costs, and a 75% plan $754/acre. The 75% plan would cover the added cost of the insurance and allow for a small gain. The important thing is to spend some time considering and making the best choice for you, your family, and your operation.