Cornhusker Economics November 12, 2014Commodity Market Analysis: Combining Fundamentals and Technicals
Commodity market participants are frequently trying to forecast prices, or anticipate how prices will change in the future. Future price movements are important for producers, merchandisers and all participants in commodity markets, since this information is essential for marketing strategies and risk management plans, among others. Two main approaches have been used to analyze commodity prices: fundamental analysis and technical analysis.
Fundamental analysis focuses on supply and demand variables and their relationship to prices. The main idea is to understand the fundamental forces of supply and demand and analyze how they affect prices. These variables are typically combined in balance sheets, as can be seen for the U.S. soybean market in Table 1. In grain markets the most relevant source of information for balance sheets is the World Agricultural Supply and Demand Estimates (WASDE) report, released monthly by the U.S. Department of Agriculture (USDA).
Balance sheets provide information about supply and usage (demand) variables. In the example of U.S. soybean market, supply variables are represented by beginning stocks, production and imports, while usage (demand) variables are represented by crushing, exports and seed. These variables tell us the total supply and total usage observed or expected within a crop year, allowing us to calculate ending stocks for that year. Note that the WASDE report is adopted here as an example of the balance sheet approach to fundamental analysis, but other sources of information can also be used to collect information about supply and demand.
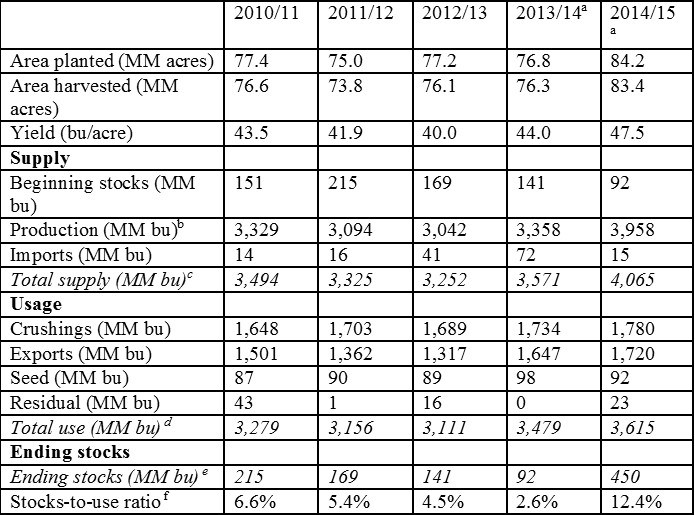
(a) USDA projections; (b) production = area harvested x yield; (c) total supply = beginning stocks + production + imports; (d) total use = crushings + exports + seed + residual; (e) ending stocks = total supply - total use; (f) stocks-to-use ratio = ending stocks/total use. Source: WASDE-USDA
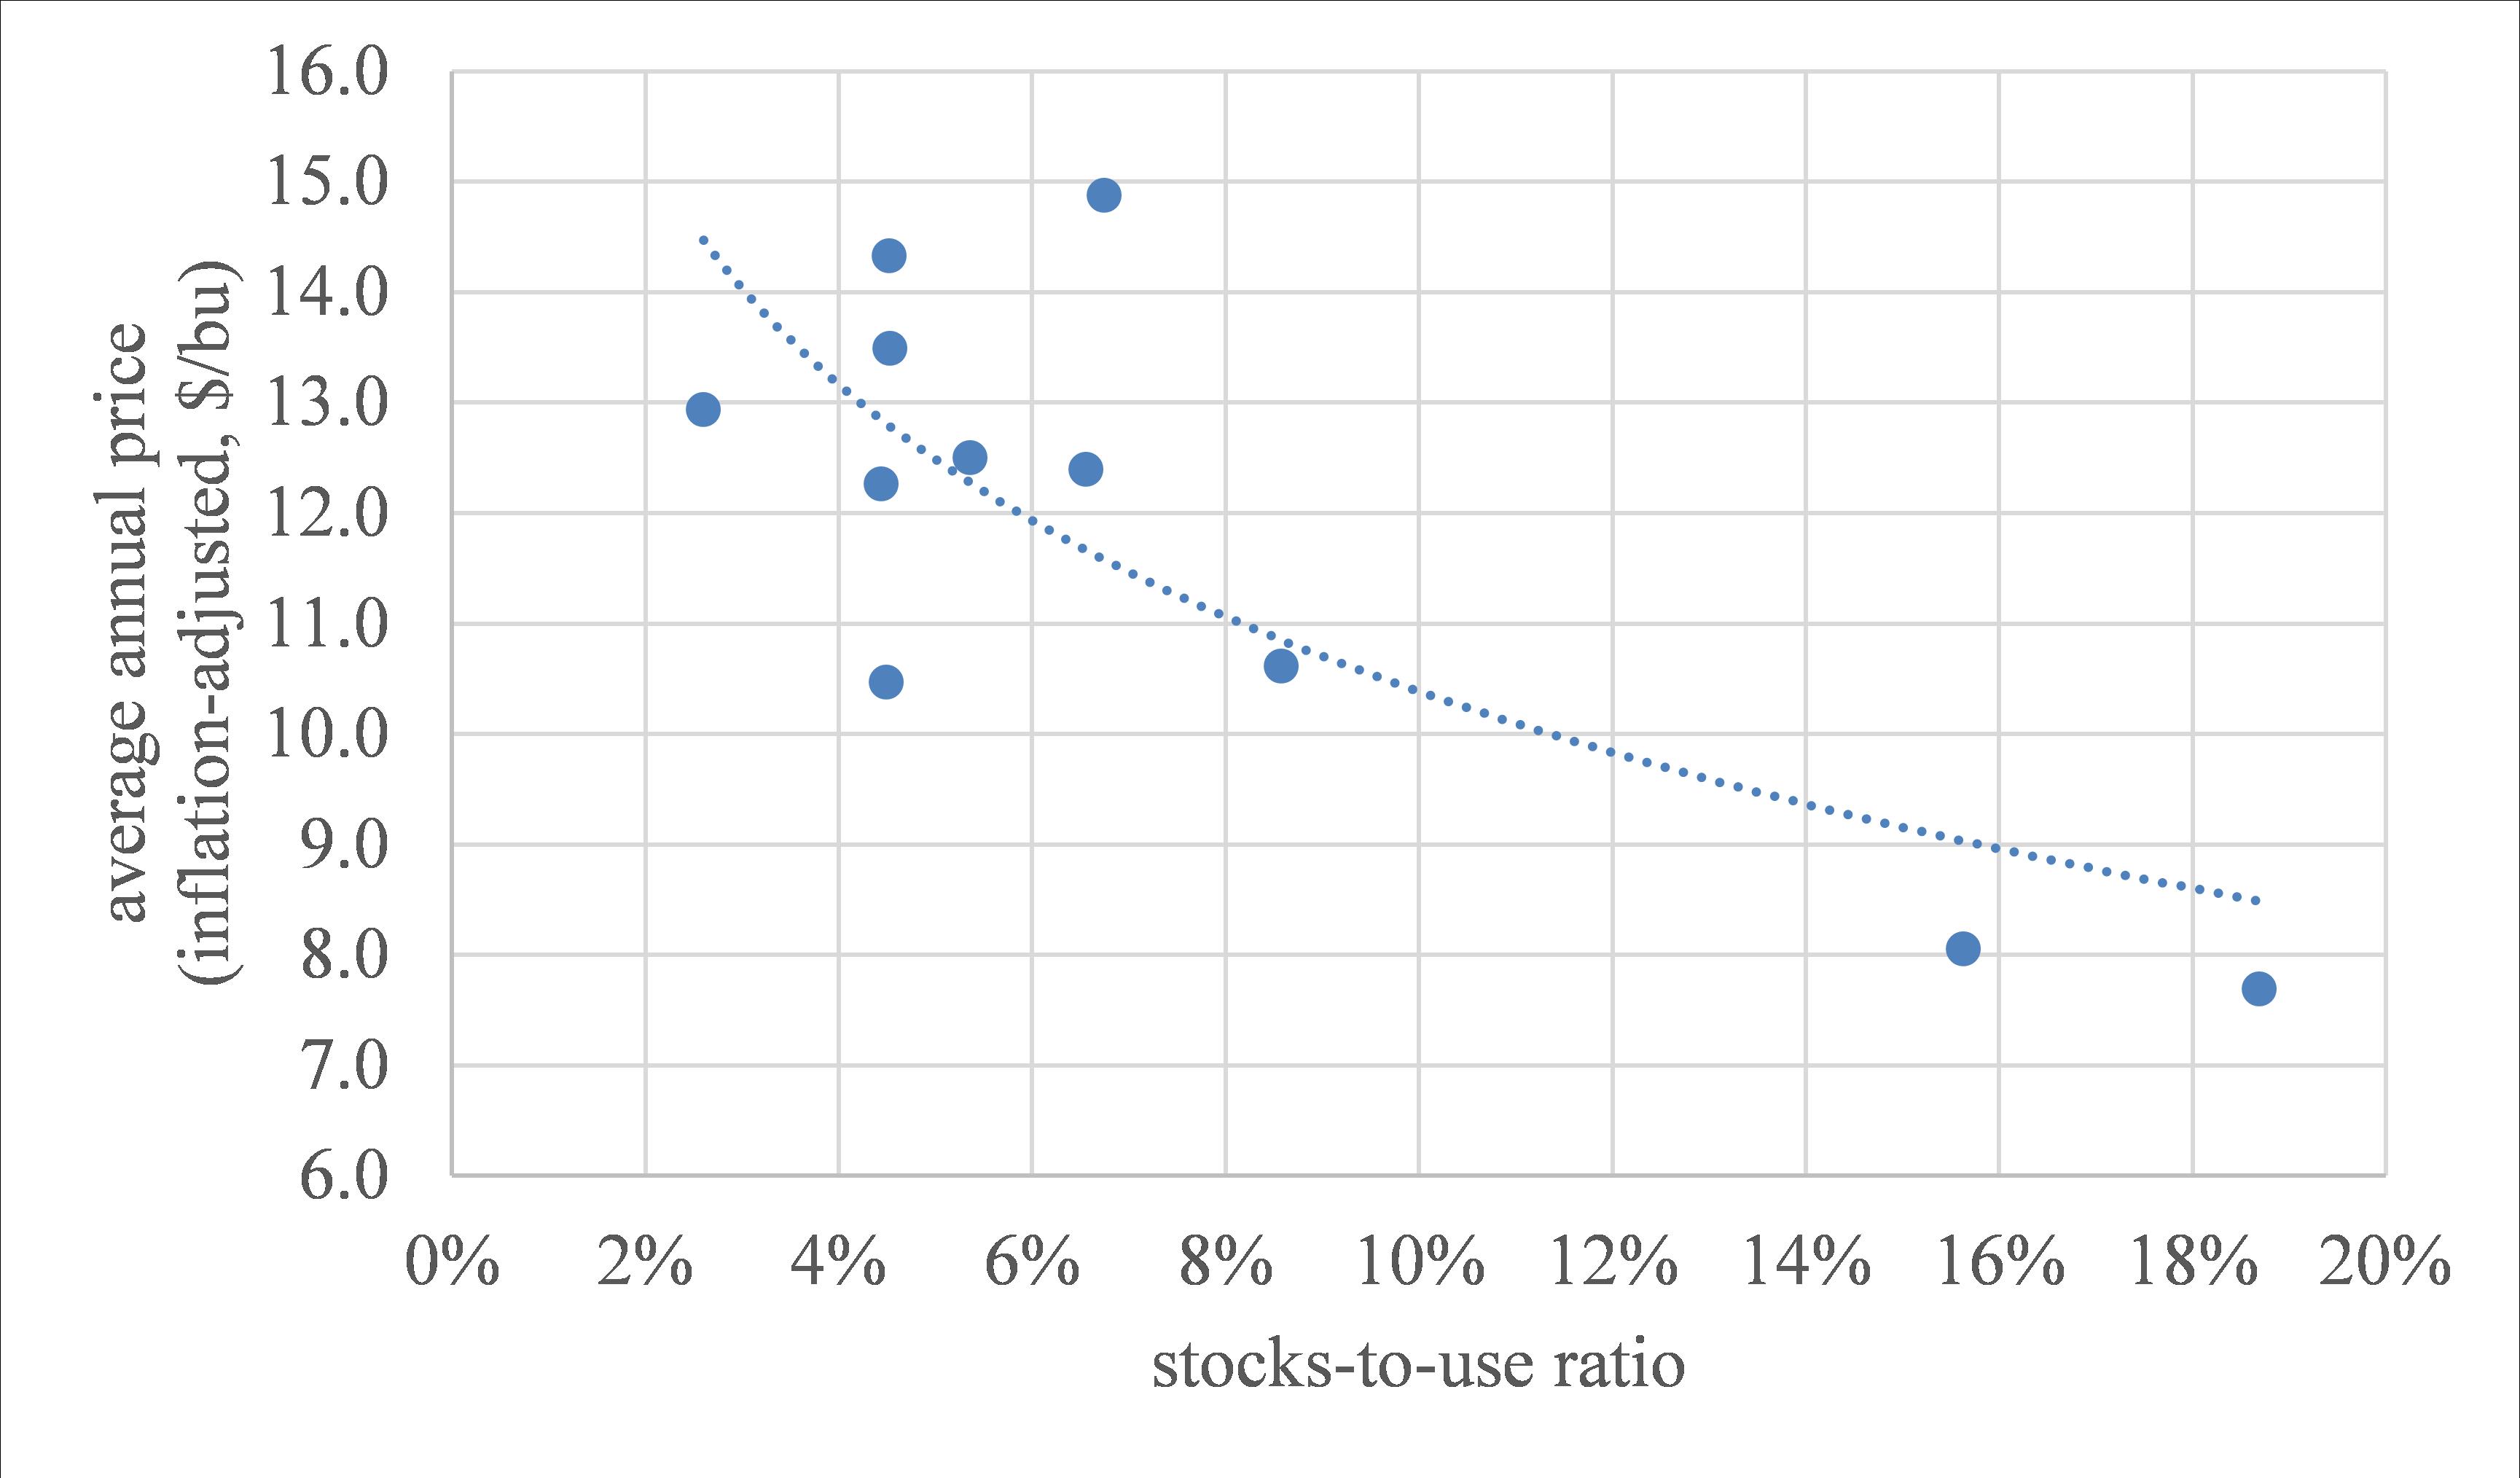
Further we can calculate stocks-to-use ratio by dividing ending stocks by total use. This number shows the amount of ending stocks as a proportion of total use, i.e. how much of total use (demand) can be satisfied with ending stocks. Figure 1 presents a scatter plot with stocks-to-use ratio and average annual prices between 2003/04 and 2012/13 (prices are adjusted for inflation). The plots show that years with higher stocks-to-use ratio (large supply relative to demand) had lower prices, while years with lower stocks-to-use ratio (little supply relative to demand) had higher prices. It is possible to estimate a trendline through the scatter points and find a statistical relationship between these two variables, as can be seen by the dotted line in Figure 1. Based on this example with data between 2003/04 and 2012/13, this simple statistical analysis indicates that a stocks-to-use ratio of 12.4% as predicted by the USDA in 2014/15 (Table 1) would lead to an average annual price of approximately $10.00/bu. Note that this estimate should be used only as a reference, and is subject to change as fundamental information about supply and demand changes.
The information provided by fundamental analysis offers a general idea about prices during a crop year. Even though balance sheets are important to see the "big picture" in a crop year, supply and demand data are usually not timely enough to offer directions on price changes in the short run. It is important to have an estimate of the average price in the crop year, but it is also relevant to know in which part of the year prices will be above and below that average, as well as to identify price trends within the year. Besides, part of the changes in prices that we see in markets every day is anticipatory, i.e. it comes from market participants' expectations about what will happen with the price in the future. For example, anticipation of WASDE reports can change grain prices regardless of whether market participants' expectations about report numbers are correct or incorrect. When the WASDE report is finally released, prices will change again according to the accuracy of the expectations rather than the report data itself. Fundamental analysis does not offer any help to predict this type of price movement.
Technical analysis can provide more help in analyzing price movements in the short run. This approach is based on the analysis of historical prices to identify patterns, which then may be used to anticipate future price movements. An issue with technical analysis is that there are plenty of techniques and indicators, and they rely on certain parameters that have to be chosen by the analyst. The large variety of technical indicators and the need to choose their parameters can make it challenging to select what indicators should be used.
(a) Average national price received by farmers.
One of the most common techniques is based on moving averages, which can be used to identify trends. Figure 2 shows an example of moving averages applied to soybean futures prices. The blue line is a 9-day moving average, the red line is a 20-day moving average and the green line is a 50-day moving average. The bar chart represents daily futures prices. In general, daily prices above moving averages indicate that the market is trending up (e.g. March and April in Figure 2), while daily prices below moving averages indicate the market is trending down (e.g. August and September in Figure 2). Further, shorter moving averages crossing longer moving averages from above signal that a downtrend may be starting (e.g. June in Figure 2), while shorter moving averages crossing longer moving averages from below signal that an uptrend may be starting (e.g. February in Figure 2).
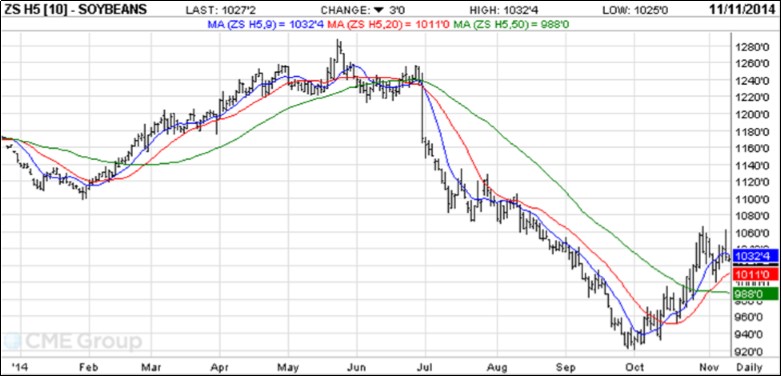
Source: CME Group
The moving averages described above are just one example of technical analysis. Many indicators also rely on moving averages in different ways, but there are several other methods in technical analysis. Regardless the method, all indicators are essentially trying to identify price patterns. The purpose of this note was just to offer an overview of technical analysis. Additional discussion of these methods are left for future editions of Cornhusker Economics.
Finally, no method is perfect; both fundamental and technical analysis have their advantages and disadvantages. No method is consistently reliable, but they can be very useful if we understand how they are developed and their limitations. If adopted properly, these two methods can help us organize market information and our ideas systematically. Then we should be able to think more methodically about commodity prices, instead of wandering without direction in the midst of all market information that comes to us daily. And that is already a great benefit of using fundamental and technical analysis.
Fabio Mattos
Assistant Professor
Department of Agricultural Economics
University of Nebraska-Lincoln
fmattos@unl.edu
402-472-1796