Cornhusker Economics September 30, 2020
Crop Yield Growth along the 41st Parallel: Contributions of Environmental vs. Human-Controlled Factors
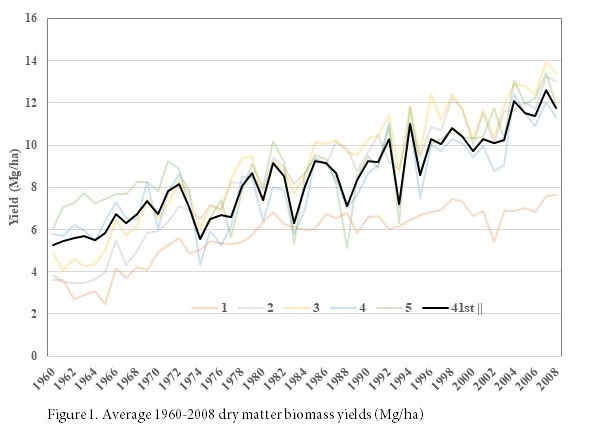
Increasing crop yields in an area we recently studied (Figure 1) has helped keep farmers competitive and helped to keep the world’s growing population fed. But how much of that yield increase has been due to more favorable climate versus human-controlled factors such as higher input use, irrigation, better genetics, etc.?
To explore this issue, we examined the causes of the 1960-2008 yield growth in 101 counties along an 800-mile segment of the 41st parallel, including much of southern Nebraska (see Panel A). While we analyzed these counties as a group, we report results by five subregions, numbered from west to east. We chose these counties because they provide a wide range of soil, climatic and agricultural circumstances that can be representative of many temperate zones across the globe.
We examine a single measure of crop yield for each county – total bone-dry above-ground biomass of all crops produced in the county divided by the number of hectares. For most grain crops, this total biomass is approximately twice the amount of grain harvested (the harvest index is approximately 0.5), but for forage crops the entire biomass production is usually harvested. Note also that yields are usually reported at average moisture levels, but here we have reduced reported levels by average crop moisture content. Our measure is close to an ecological concept called net primary production – in this case net agricultural primary production.
We present here a brief summary of our study and results in graphic form, adapted from a more detailed report: (Trindade, Fulginiti, and Perrin, 2020).
Environmental contrasts
From west to east, the study area ranges from warm and very dry, through hot and dry to warm and moist. The High Plains Aquifer has provided an ample supply of groundwater to much of Regions 1-3, while rainfall is generally nearly adequate for maximum or near maximum yields in Regions 4 and 5 (Panel B). To the extent that temperatures affect yields, the main issue in the study area is high temperatures, which we measure as the amount of time the crop was exposed to various temperature ranges, measured in degree days (total hours divided by 24). Temperatures below 35°C did not have important impacts on yields, but those above 35°C (95°F) certainly do. As is evident from Panel C, Central Nebraska has the greatest amount of time above 35°C, with far less in many of the Iowa counties.
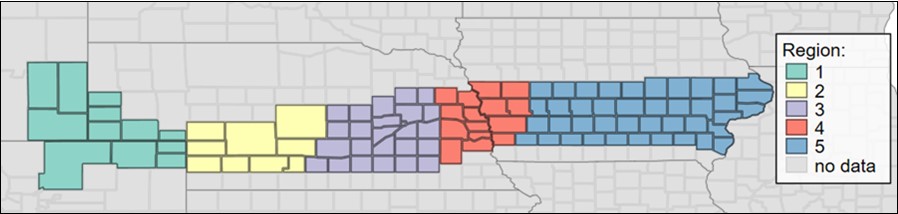
Panel A. Study counties along the 41st parallel N, by subregion
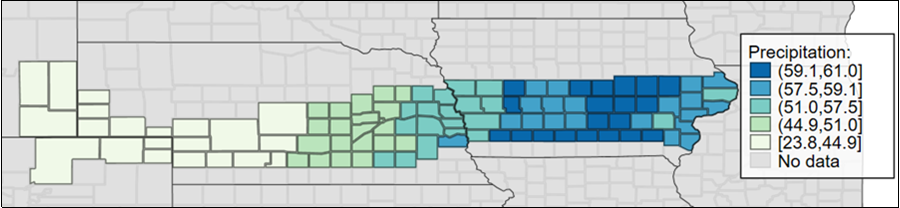
Panel B. Average growing season precipitation in cm (1960-2008)
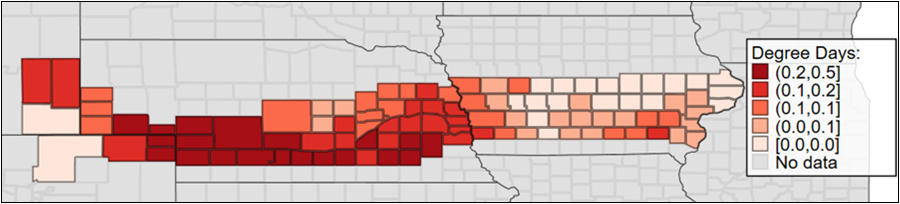
Panel C. Average amount of time crop was exposed to temperatures above 35°C (95°F)
Farm responses to environmental circumstances
Perhaps the most apparent response to the environment has been increases in irrigation in Central Nebraska, where the hottest and some of the driest counties happen to overlie the High Plains (Ogallala) Aquifer. Irrigation began here in the 19th century, and by the early years of this study, about a third of cropland in Regions 1-3 was under irrigation. This ratio increased to about two-thirds by the end of the period. It has been shown in a number of studies that irrigation reduces damage from high temperatures, as well as from dry soils.
During the 49 years of the study, fertilizer use more than doubled, and the use of chemicals tripled by different amounts across the regions (but we do not report those data here). It is clear that the genetics of crops improved dramatically over this period, and it is also clear that mechanical control of planting, cultivating and harvesting the crops also contributed to higher yields. Unfortunately, we were unable to find satisfactory measures of these inputs, so we lumped them together in a linear time trend to estimate their joint average annual contribution to yields.
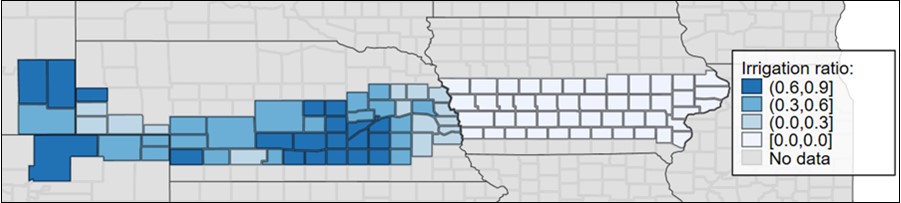
Panel D. Average ratio of land irrigated to total agricultural land (2008)
Estimated contributions of various factors to yield gains
We used regression techniques to attribute differences in yields, across time and space, to various factors. Somewhat to our surprise, the contributions of changes in weather across the 49 years resulted in a negligible change in yields, a reduction of about 1% (Figure 2). An exception occurred in Region 1 (the westernmost region), where higher rainfall and fewer hot days combined to increase yields by nearly 25% between 1960 and 2008.
This is not to say that temperature and rainfall had no effect on yields – far from it. During the 1980’s, for example, abnormally high temperatures reduced area-wide yields by 6% (9% in Iowa), while during the 1990’s a weather turnabout increased area-wide yields by 1%. Weather changes over the study period were small, and when pooling all counties together, their effect was negligible.
We note that soil organic matter (SOM) declined substantially over this period, but resulted in an estimated yield reduction of less than 2%.
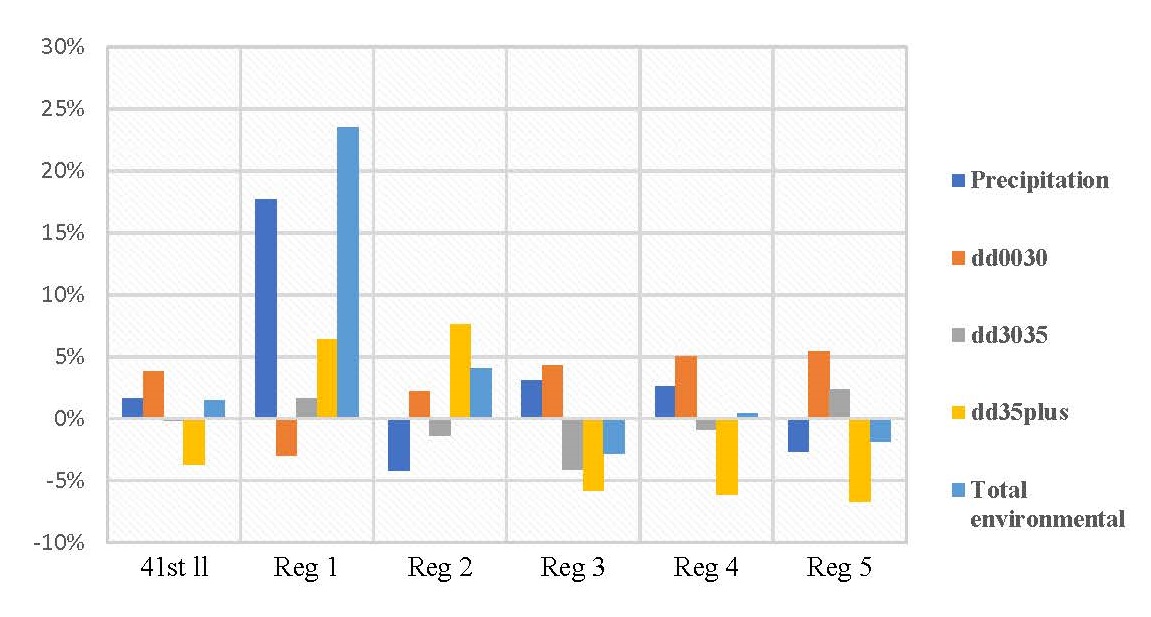
Figure 2. Environmental contributions to yield increases along the 41st parallel, 1960-2008
Figure 3 illustrates our estimates of the yield gain due to various human-controlled factors. These are far more significant effects than those due to environmental factors. The unspecified technical change contributed an area-wide gain of 62%, ranging from about 50% in the west to about 65% in the east. Increases in irrigation contributed yield gains of around 50% in Regions 2 and 3, but only 17% when those production areas are pooled with the non-irrigated areas. Increases in fertilizer and chemicals usage contributed to gains of 20-25%.
Taken together, these human-controlled factors contributed a yield gain of 137% across the area, ranging from 231% in Central Nebraska to 103% in the east.
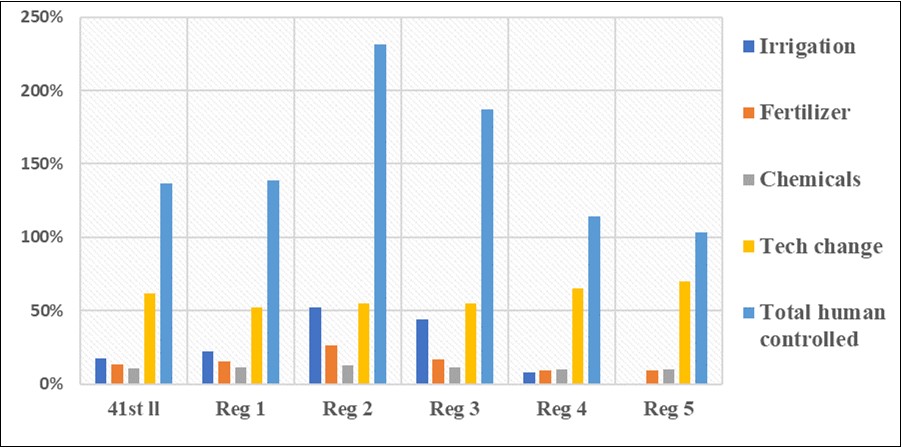
Figure 3. Contributions of human-controlled factors to yield increases along the
41st parallel, 1960-2008
Conclusions
We have estimated that, across this diverse transect of the 41st parallel, changes in human-controlled factors increased yields by about 137% between 1960 and 2008, whereas changes in environmental factors reduced yields by only about 1%. While we estimated the marginal impact of various factors at the area-wide level, we evaluated results for each of the five regions within the transect. We did find significant regional differences in many of the predictions, given regional differences in environment and managerial practices.
The predominance of human-controlled factors over environmental factors in raising yields is promising for the prospects for agriculture to feed the world’s growing population and for agriculture in this region to continue to be competitive. It also provides encouragement for continued funding of the public research that is so much responsible for this predominance of human-controlled factors over environmental factors.
Reference: Trindade, Federico, Lilyan Fulginiti and Richard Perrin. 2020. A half century of yield growth along the forty-first parallel of the Great Plains: factor intensification, irrigation, weather, and technical change. Dept of Agricultural Economics, U of Nebraska, https://ageconsearch.umn.edu/record/305568 .
Federico Trindade
Evans School of Public Policy and Governance
University of Washington
University of Nebraska-Lincoln
ftrindade@gmail.com
Phone: (402) 570-3820
Lilyan E. Fulginiti
Department of Agricultural Economics
University of Nebraska-Lincoln
lfulginiti@unl.edu
Phone: (402) 472-0651
Richard K. Perrin
Department of Agricultural Economics
University of Nebraska-Lincoln
rperrin@unl.edu
Phone: (402) 472-9818