Cornhusker Economics August 6, 2014
Diet and Health Care Cost
In the article Putting Your Car Where Your Mouth Is: Diets and Carbon Emissions, published in the April 23, 2014 issue of Cornhusker Economics, we compared the environmental damages in terms of CO2 emissions associated with the U.S. diet relative to the Japanese, Mediterranean (represented by Greece), French, and Nordic (represented by Finland) diets. In this article, we compare the health care cost associated with the U.S. diet and the same four alternative diets. The theme of both articles is sustainable consumption, and specifically sustainable diets.
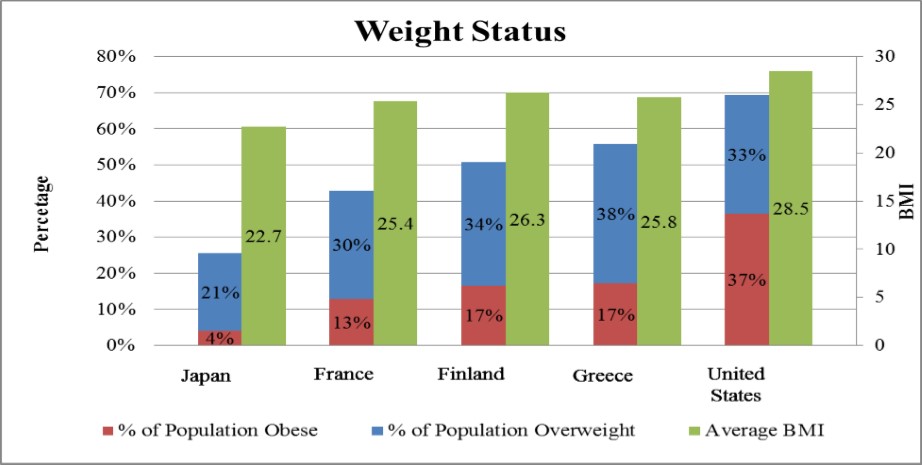
As a first step to finding the relationship between diet and health care cost, we estimate the relationship between the respective countries' diets and body mass index (BMI) using data from the Food and Agricultural Organization of the United Nations, the Organization for Economic Co-operation and Development, the World Health Organization, and the World Bank. BMI is a metric often used to classify weight and indicates the health status of a population. Figure 1 shows the average BMI for each of the 5 countries and the percentage of the population that is either overweight or obese. The United States has the highest average BMI (28.5), with 69.4 percent of the adult population overweight or obese, also the highest. Of this 69.4 percent, 32.9 percent are classified as overweight and 36.5 percent are classified as obese (OECD, 2013).
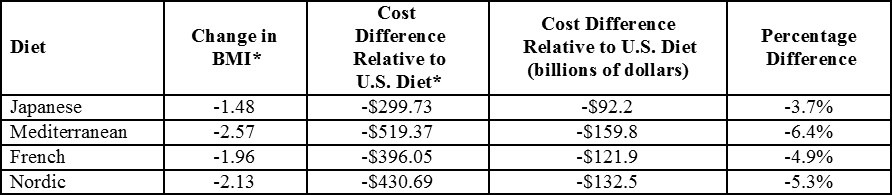
 The first numeric column of Table 1 shows the change in the average U.S. BMI given a shift to any of the alternative diets while daily caloric consumption is fixed at 3,688 kilocalories (kcal) per capita, the U.S. level in 2009. In all cases, a shift in dietary composition is associated with a reduction in U.S. BMI. A Mediterranean-type diet results in the largest reduction in BMI at 2.57 units.
Next, the change in BMI due to a dietary shift is translated into a change in health care cost. We use Wang et al.'s (2006) estimate of per-unit health care costs of BMI. The authors estimate with each unit increase in BMI over 25, annual health care cost increases by $202.30 per capita ($119.70 in medical cost and $82.60 in pharmaceutical cost).
The second numeric column in Table 1 reports the difference in annual per capita health care cost relative to the U.S. diet. Savings of $519 per capita per year in health care cost are realized by a shift to a Mediterranean-type diet. This translates to a reduction of about $160 billion in U.S. health care cost. That is equivalent to 6.4 percent of the $2.5 trillion spent in the U.S. on health care in 2009.
The results indicate that a shift in dietary composition may lead to more sustainable consumption through lower BMI, and thus reduced health care cost.
Sarah Rehkamp, M.S. Graduate Student
Department of Agricultural Economics
University of Nebraska Lincoln
sarah.rehkamp@huskers.unl.edu
Azzeddine M. Azzam, (402) 472-5326
Professor
Department of Agricultural Economics
University of Nebraska Lincoln
aazzam1@unl.edu
Christopher R. Gustafson, (402) 472-2336
Assistant Professor
Department of Agricultural Economics
University of Nebraska Lincoln
cgustafson6@unl.edu
References
OECD. (2013b, October). Non-Medical Determinants of Health: Body Weight. Retrieved January 15, 2013, from: http://stats.oecd.org/
Wang, F., McDonald, T., Bender, J., Reffitt, B., Miller, A., & Edington, D. W. (2006). Association of healthcare cost with per unit body mass index increase. Journal of Occupational & Environmental Medicine, 48(7), 668-674. doi:10.1097/01.jom.0000225045.77734.f4
World Health Organization. (2014, January 13). BMI classification. Retrieved January 13, 2014, from World Health Organization: http://apps.who.int/bmi/index.jsp?introPage=intro_3.html