C0rnhusker Economics Nov 2, 2022
Historical Corn Price Evolution Implications for Pre-Harvest Hedging
Commodity markets evolve through information provided by participating buyers and sellers and throughout this process the conditions in which commodity markets work are revealed. Producer pre-harvest commodity marketing can be further developed by incorporating information on how commodity markets work, leading to better farm financial performance.
We investigate how commodity markets have historically evolved from spring to fall. While changes in future prices appear random in any given year, observing average daily prices over 32 years could uncover a seasonal tendency. In the past 32 years, the average daily price tends to be higher in the spring than the fall, suggesting an average seasonal tendency exists. This seasonal tendency (or drift) has led many market advisors to suggest pricing some of producer’s expected production before harvest.
Many producers have been reluctant to forward price using either futures or forward cash contracts before their production is known. Pre-harvest hedging did not perform well for many corn producers this past year as the price is higher today than offered in the spring. Adding insult to injury many producers in both Nebraska and the surrounding region have less production to sell due to drought conditions. This year provided a painful, but important example that marketing plans based on average tendencies do not always work out in any given year. However, it is still useful to look back at past price history to see if marketing performance can be improved over the long run by having a marketing plan in place.
With our focus on pre-harvest hedging, we calculate the change in price between the first trading day in March and the last trading day in November using the December corn futures contract. The first trading day in March reflects the release of the crop insurance projected price. The last trading day in November just before when the December Corn Futures contract enters delivery.
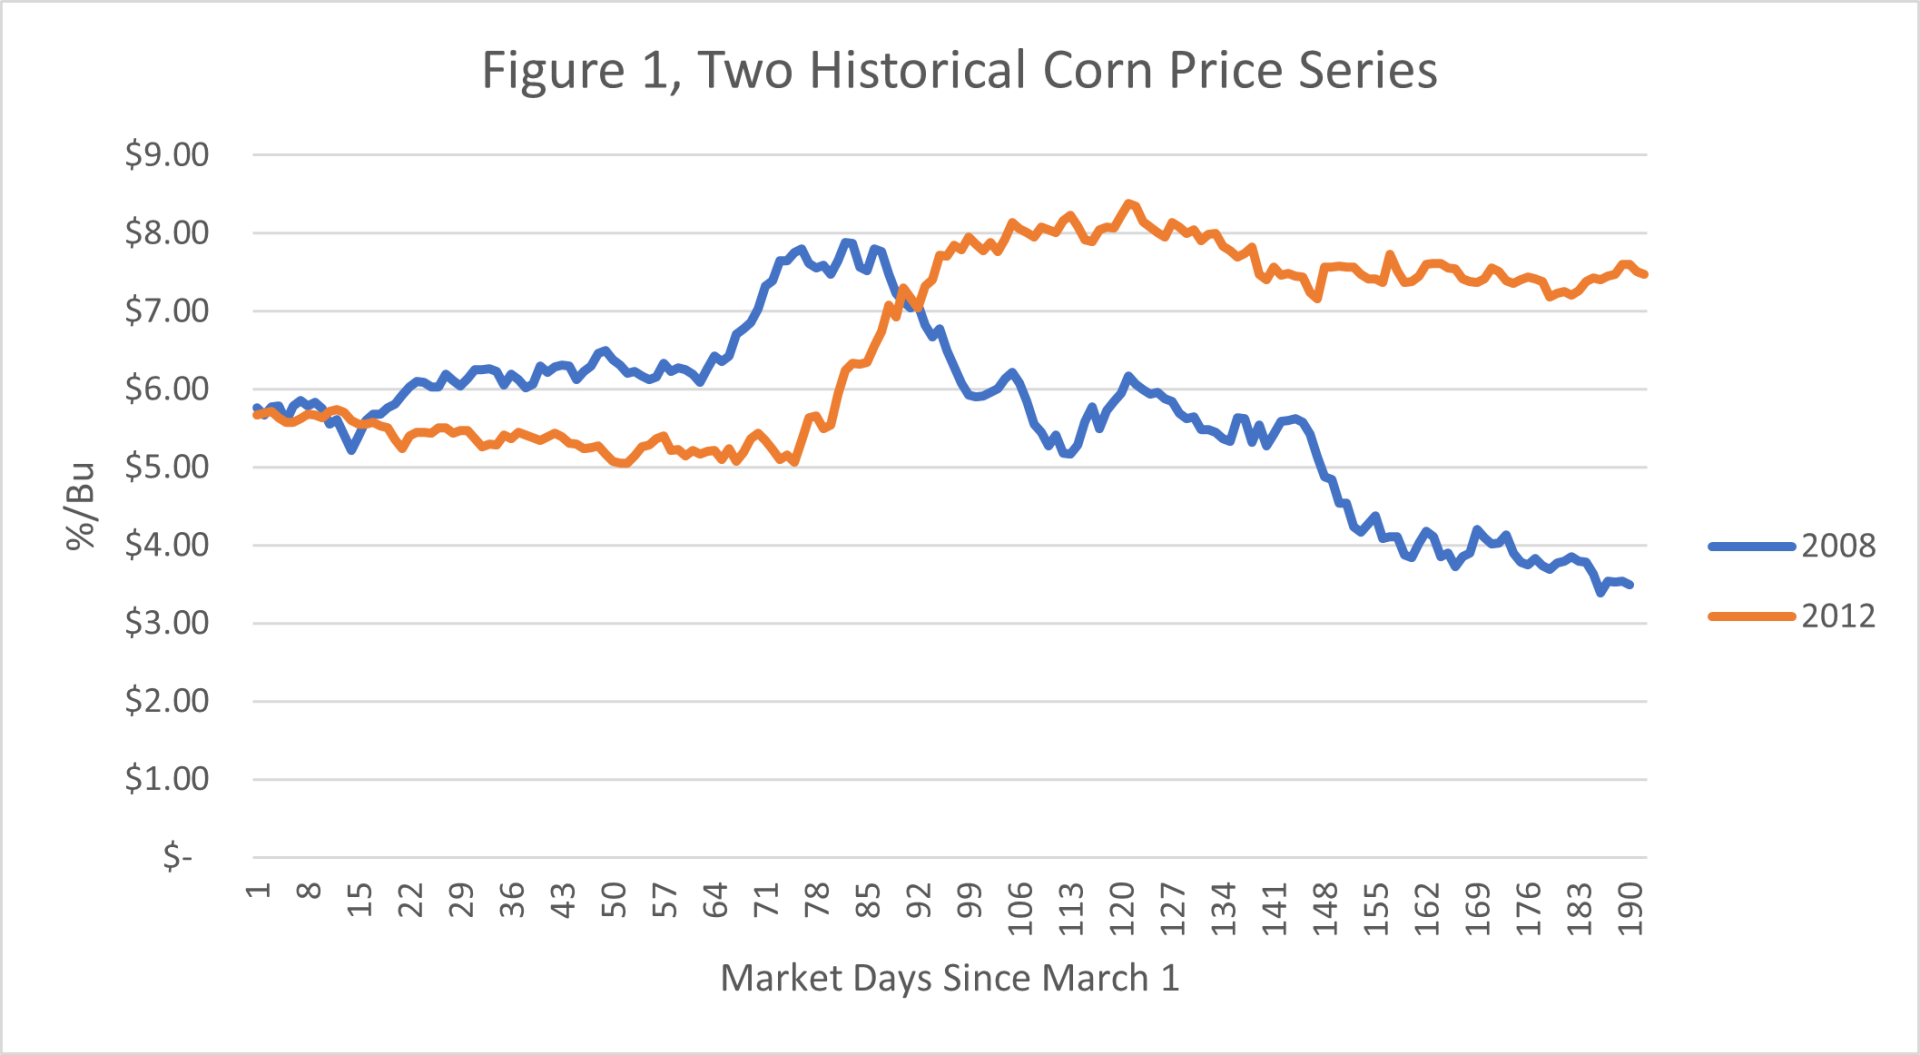
Figure 1 presents the price series of two years, 2008 and a drought year, 2012. In 2008, fall prices ended up lower than the initial price on the first day in March while in 2012, fall prices ended higher. In 2008 pre-harvest hedging using a marketing plan that priced anticipated production in the spring rewarded producers by giving them a higher overall price. However, in 2012, springtime hedging punished producers because the fall price was higher than the spring price.
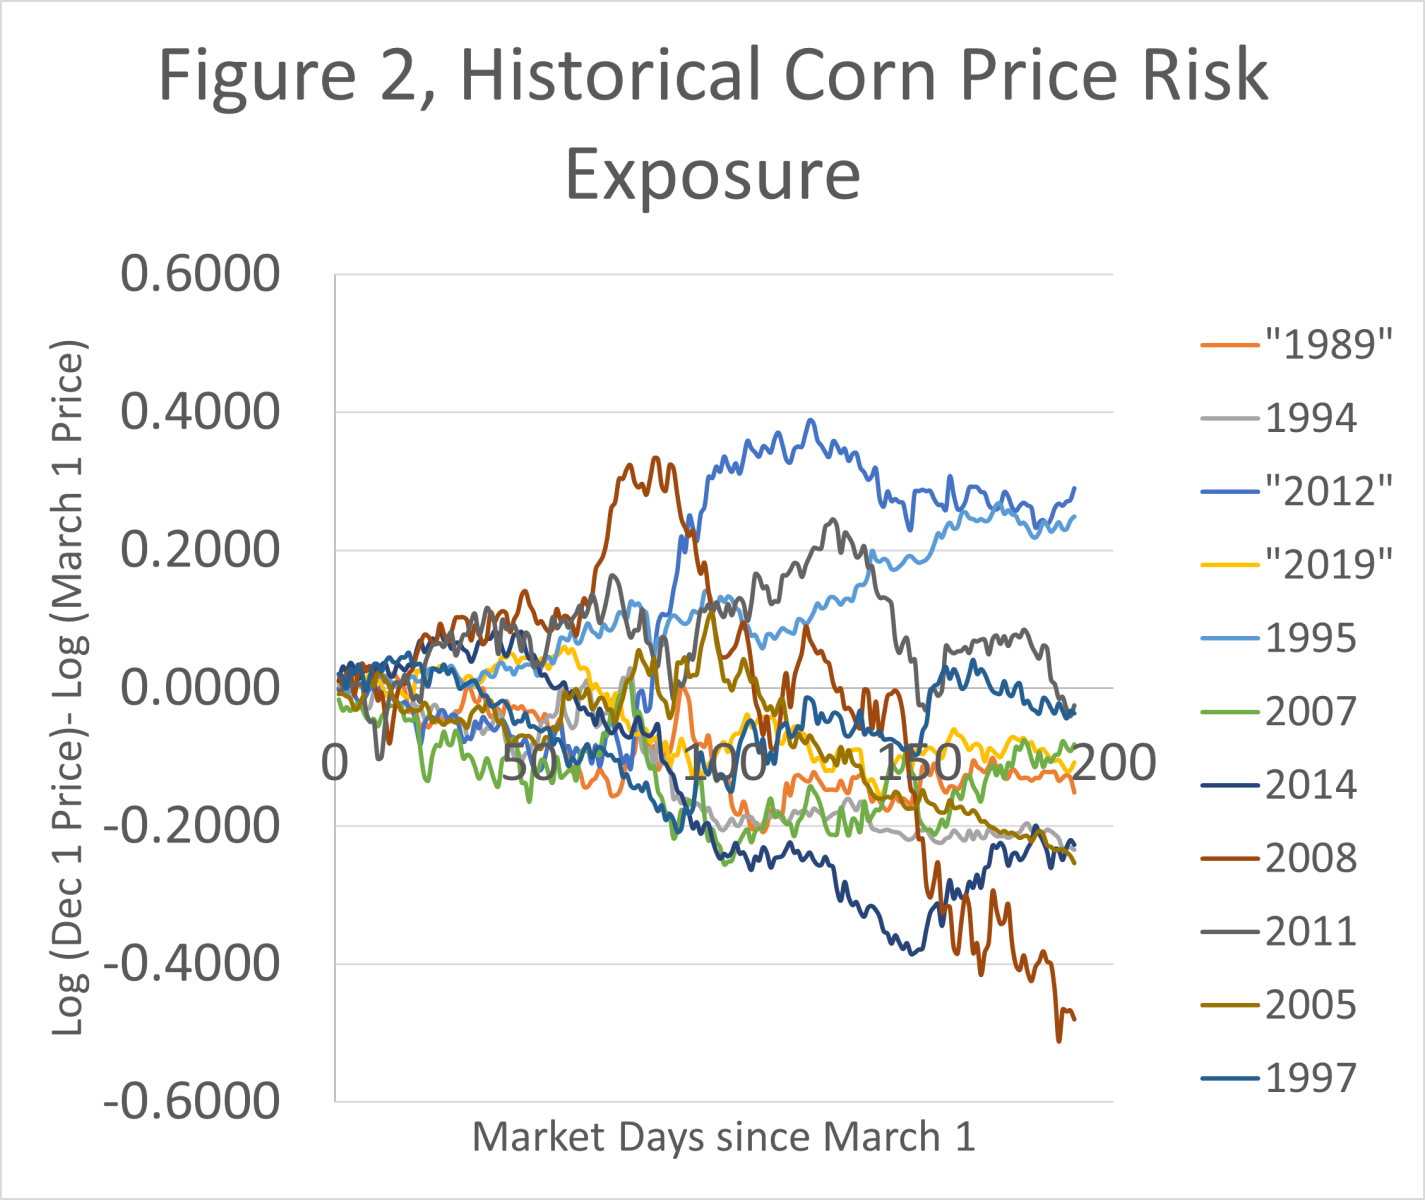
Adding more years to the analysis gives a better picture of price risk by revealing how corn prices can change from spring to fall. In Figure 2, price risk exposure is calculated as the log change in price on any given day from the price on March 1. As you can see from Figure 2 adding additional years exposes both the randomness of paths prices between years and price risk exposure. In some years, prices start off moving lower, followed by moving higher toward December while in other years the opposite occurs. At the end of the preharvest marketing window, yearly futures prices end up in a wide range, revealing the price risk exposure.
To reduce the noise of individual year prices, we introduce the concept of average daily price by averaging the daily price over the years studied. We construct a more useful view of our daily price time series by looking at the difference between the log average daily price from March 1st and the log average daily price on a given marketing day up to December 1st. This method of averaging the price on each marketing day first, and then looking at the evolution of the log difference provides the modified seasonal, Figure 3.
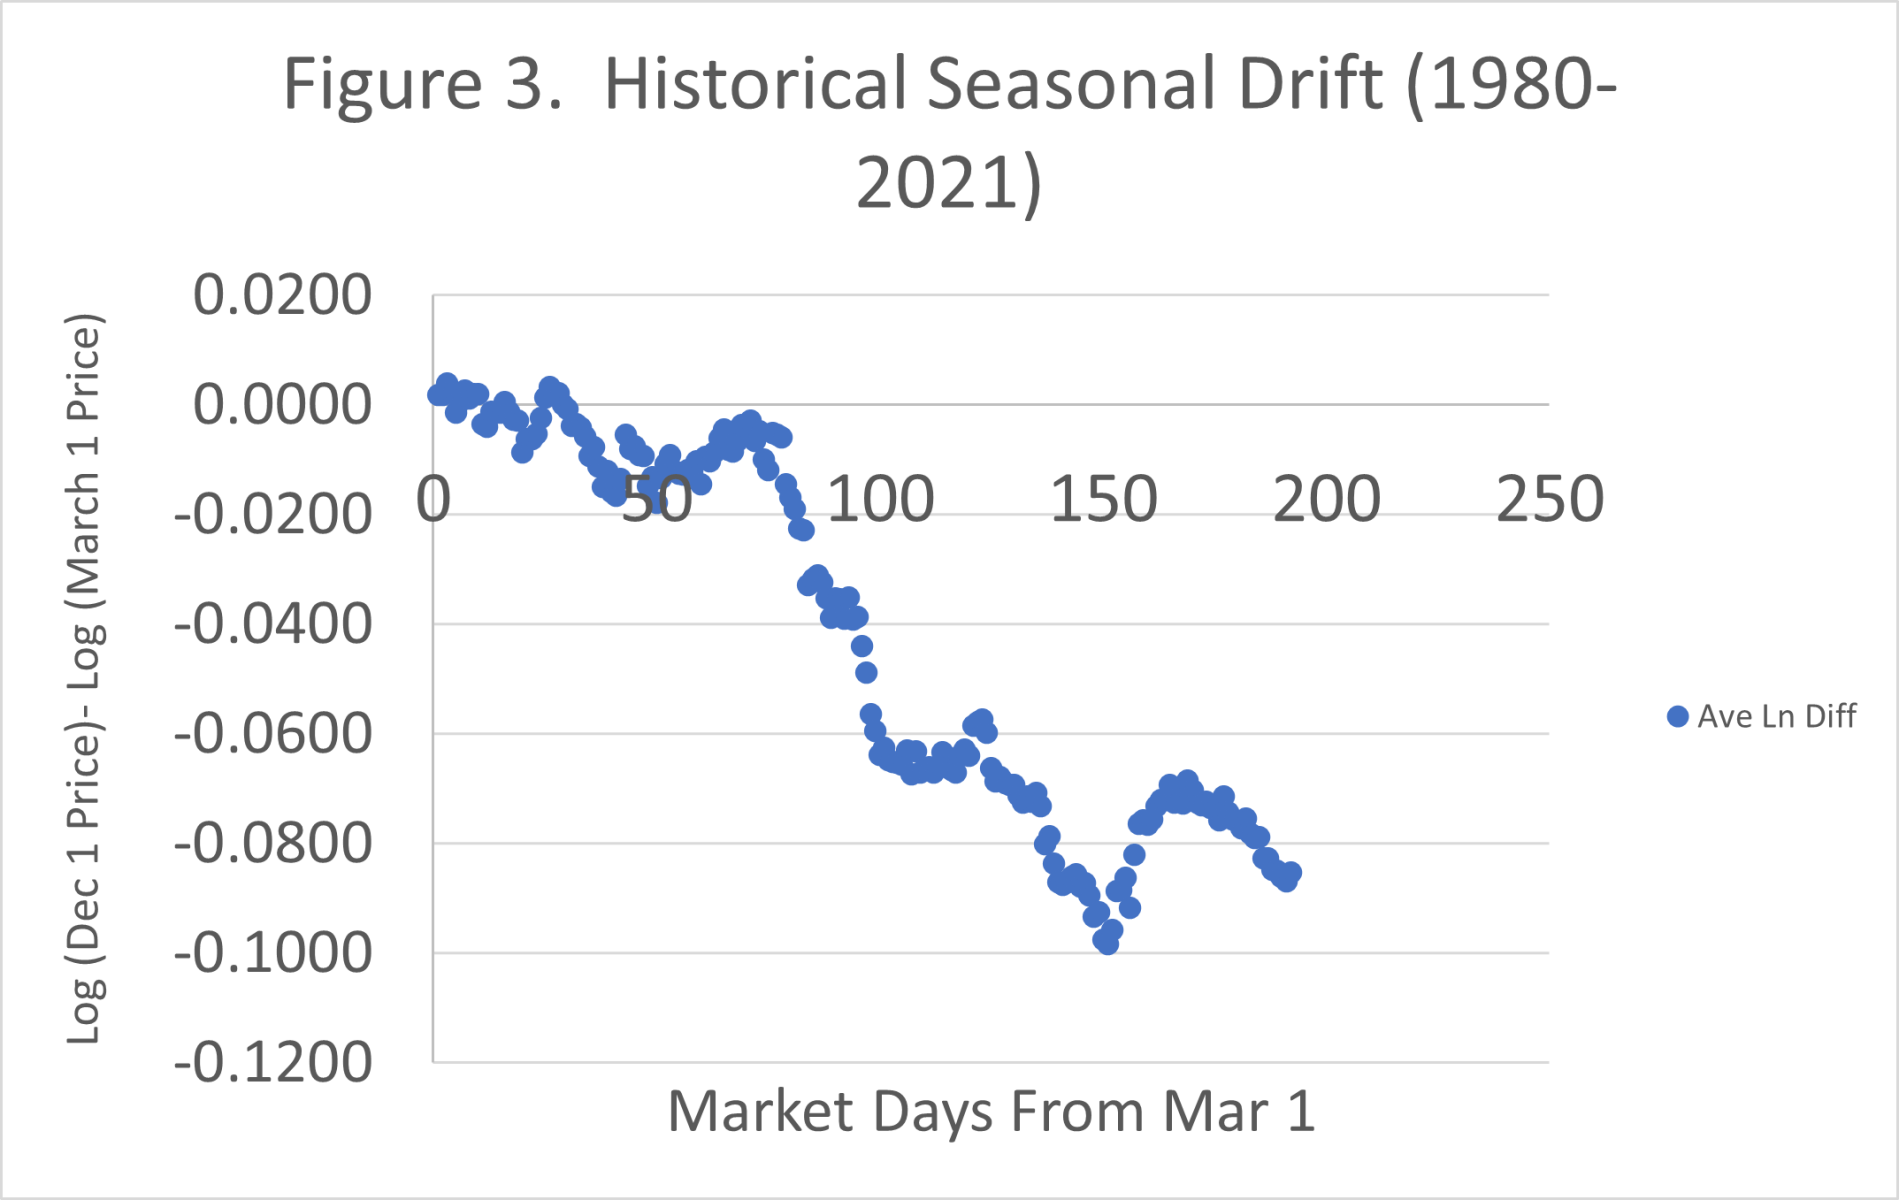
The results shown in Figure 3 suggest that on average, price tends to be higher in the spring than in the fall. This often-noted seasonal trend leads to the often-recommended advice to sell some of your production in the spring and early summer. This reasonable marketing advice is echoed here based on the average past price performance over the 32 years. While we have identified gains to a consistent pre-harvest hedging strategy, hedging costs must be considered. We leave this up to the reader as there is a wide range in pre-harvest hedging costs through different marketing methods and elevators. For the first seventy-five trading days or from March 1 to about June 15, drift remains close to zero. Then drift starts to decline with the minimum occurring around day 150 or October 1. This observed drift gives producers a financial advantage over time as the odds of receiving a higher price when averaged over many years are higher.
The seasonal tendency found here supports repeatedly following a marketing plan where some production is hedged pre-harvest, especially if the market is offering a projected profit. The historical data shown here suggest that this simple marketing strategy provided the producer with an average advantage over time. However, each year a producer can either have a gain or a loss. Yearly gains and losses are clear from viewing Fig 1 and Fig 2. Therefore, pre-harvest hedging while providing a financial advantage overall, can add to a producer’s risk in one year because producers must survive the challenges of the short run in order to arrive at the long run. The tradeoff between risk and reward deserves further study. We are addressing this by analyzing further time-dependent computer models. While a seasonal was found in the historical data, only the evolution of additional unknown future price paths will contribute to additional evidence of whether a seasonal pattern exists or that the historical seasonal used here was an anomaly due to the short number of years.
Cory Walters
Associate Professor
Department of Agricultural Economics
University of Nebraska-Lincoln
402-472-0366
cwalters7@unl.edu
Richard Preston
Preston Farms
Hardin County, Kentucky
rkpreston@windstream.net