Cornhusker Economics March 31, 2021
Monitoring and Trends of Antimicrobial Use in Livestock Production
There has been growing consumer and human medical profession concern about the use of “Shared Use / Medically Important” antimicrobials in food-animal production. The concern partially stems from the concern that livestock and poultry fed antimicrobials can develop resistant bacteria which can then be passed on to humans primarily via consumed meat and poultry products. To curtail this real or hypothetical consumer concern, major restaurants, food service companies, food processors, and supermarkets have pledged to reduce or eliminate meat and poultry that were raised with a non-negative quantity of antimicrobials. For example, Wendy’s© pledged that 50% of procured beef would come from sustainable sources by 2022. In 2020, they reported that already over 40% of beef entering their supply chain was raised following strict animal welfare and sustainability standards. In 2014, Chick-fil-A© pledged that all chicken served in their restaurants would be raised under a No Antibiotics Ever program by the end of 2019 – a goal that was met in May 2019. Other companies have already made similar pledges/changes for beef, pork, and chicken. Over the last 10 years the federal government, private industry, and third-party verification programs have begun to monitor the sales and use of antimicrobials along the supply chain. This article briefly reviews who is conducting the monitoring efforts and what are some of the preliminary trends on the sales and use of antimicrobials in the U.S. food-animal production.
Food and Drug Administration
Federal and international organizations have expressed growing concerns that the use of shared-class antimicrobials in livestock production for growth promotion and disease prevention is linked to increased health risks and antimicrobial resistance in humans (Centers for Disease Control and Prevention, 2013; World Health Organization, 2012). These concerns have led to two primary legislative mandates. First, the United States Congress tasked the Food and Drug Administration (FDA) to monitor and publicly report the sales of antimicrobials by route and class in food animal production beginning in 2009. In 2017, the FDA expanded on this mandate and began reporting antimicrobials for animal species by class, where applicable. Second, the United States Congress required all antimicrobials administered in livestock or poultry feed and water to be prescribed by a practicing veterinarian. Before this law, known as the Veterinary Feed Directive, producers were able to purchase antimicrobials over the counter but often in consultation with veterinarians. This law formally went into effect on January 1, 2016.
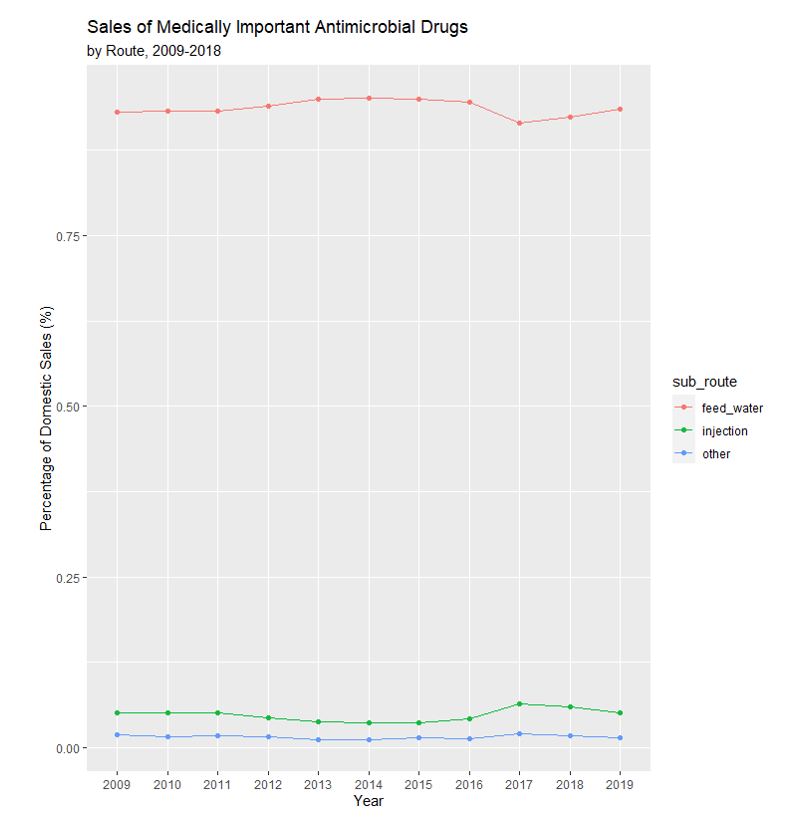
Each December, the FDA releases a report classifying and quantifying antimicrobial sales used in livestock production as either “Medically Important” or “Not Medically Important” for use in human health. They further classify antimicrobials by route use either a) feed and water, b) injection, or c) other. Figure 1 plots medically important antimicrobial sales[1] by the route. Before the implementation of the VFD, antimicrobial sales were fairly constant. After the VFD took effect there was an initial drop in the total antimicrobials sold (kg/yr.) for use in feed and water and has remained steady since then. The “other routes” amount stayed relatively constant largely unaffected by changes to the VFD. The total antimicrobials sold for “injection” was constant before the VFD and increasing after implementation. One interpretation for the large drop but then plateau in feed and water antimicrobial sales is that the difference between pre-VFD and post-VFD represented the overuse of antimicrobials. Further, an explanation for this rise in injectable antimicrobial sales is the ability to manage the health of animals. For example, cattle classified as high-risk (i.e., have a high chance of acquiring Bovine Respiratory Disease (BRD) within the first 45 days after arriving at a feedlot) can be given antimicrobials via injection. This practice, commonly known as metaphylaxis, is used by 39% of U.S. feedlots with 1000+ head 1capacity selectively on 17% of cattle (United States Department of Agriculture, 2019). Another way to manage BRD is using Chlortetracycline (CTC) in the feed. Producers desiring to manage BRD but unable to acquire a veterinary feed prescription for CTC may use an injectable antimicrobial. Though used under slightly different scenarios, CTC and metaphylaxis could be used as imperfect substitutes to control BRD.
United States Department of Agriculture Animal Plant and Health Inspection Service (USDA-APHIS)
Other federal organizations involved in production agriculture have also monitored the use of antimicrobials in animal production. The United States Department of Agriculture Animal Plant and Health Inspection Service (USDA-APHIS) has been the primary agency involved in surveying producers about the frequency and type of use of antimicrobials in feed, water, and injection. The primary objective in asking these questions is to observe national and regional trends over time. For example, in 2011 and 2016 U.S. cattle feedlots were asked about their use and type of antimicrobials used in feed, water, and via injection.
Tables 1 and 2 show how the share of different antimicrobials used and administered either via injection or in feed and water changed between 2011 and 2016, respectively. These tables show that changes in use and type of antimicrobials used were already occurring before the implementation of the VFD. There are two primary ways that antimicrobial use can be presented – percent of feedlots or percent of cattle. Percent of feedlots shows how prevalent a certain practice or specific antimicrobial is in the industry. Percent of cattle shows the intensity of use within the cattle supply chain. For example, the percent of feedlots using the injectable antimicrobial Tulathromycin reduced from 45% to 18% between 2011 and 2016 and the percent of cattle receiving Tulathromycin decreased from 30% to 5% (see Table 1). Similar findings are present for antimicrobials in feed and water (see Table 2). These percentages can be “rescaled” to show the share of antimicrobials uses over time. This “share of use” can be loosely interpreted as the market share of each antimicrobial. Contrary to the previous example of Tulathromycin decreasing in use both as a percent of feedlots and percent of cattle, the share of Tulathromycin increased from 26% to 28% as a percent of feedlots and 29%-30% as a percent of cattle. As before, similar findings can be seen for antimicrobials in feed and water.
Conclusion
Public concern over the use of shared-class antimicrobials in animal feeding operations, antimicrobial-resistant bacteria, and potential antimicrobial residuals in meat has escalated in recent years. Although most consumers agree that medicating sick animals is appropriate, opinions diverge on the acceptable use of antimicrobials administered to food-producing livestock (Landers et al., 2012). Several agencies are already monitoring the sales and use of antimicrobials with the hope of continuing to develop more efficient ways to match antimicrobials with animal health status. The data suggest that livestock producers have already made considerable progress towards this goal.
| Feedlots | Cattle | ||||||||||
|---|---|---|---|---|---|---|---|---|---|---|---|
| Antimicrobial | Percenta | Shareb | Percent | Share | |||||||
| 2011 | 2016 | 2011 | 2016 | 2011 | 2016 | 2011 | 2016 | ||||
| Amoxicillin | 0 | 0.5 | 0 | 0.78 | 0 | 0 | 0 | 0 | |||
| Ceftiofur | 39.7 | 8.7 | 22.69 | 13.55 | 13.8 | 1.1 | 13.81 | 6.51 | |||
| Danofloxacin | -c | 0.8 | - | 1.25 | - | 0 | - | 0 | |||
| Enrofloxacin | - | 1.1 | - | 1.71 | - | 0.2 | - | 1.18 | |||
| Florfenicol | 9.2 | 3.8 | 5.26 | 5.92 | 6.4 | 0.9 | 6.41 | 5.33 | |||
| Florfenicol with flunixin meglumine | - | 1.4 | - | 2.18 | - | 0.6 | - | 3.55 | |||
| Gamithromycin | 4.3 | 5.1 | 2.46 | 7.94 | 0.1 | 3.2 | 0.1 | 18.93 | |||
| Oxytetracycline | 17.4 | 7 | 9.94 | 10.9 | 4 | 1.5 | 4 | 8.88 | |||
| Penicillin | 0 | 1.2 | 0 | 1.87 | 0 | 0.1 | 0 | 0.59 | |||
| Tildipirosin | - | 5.8 | - | 9.03 | - | 2.5 | - | 14.79 | |||
| Tilmicosin | 57.6 | 10 | 32.91 | 15.58 | 46 | 1.7 | 46.05 | 10.06 | |||
| Tulathromycin | 45.3 | 18.4 | 25.89 | 28.66 | 29.5 | 5.1 | 29.53 | 30.18 | |||
| Other | 1.5 | 0.4 | 0.86 | 0.62 | 0.1 | 0 | 0.1 | 0 |
Note: aNumbers do not sum to 100 because individual feedlots can choose to use more than one type of antimicrobial for metaphylaxis; bShares are derived by dividing the percent of each drug by the sum total across the percent column. cProducers were not asked if they used this type of antimicrobial.
Source: NAHMS (2013, 2019) and author’s calculations.
| Feedlots | Cattle | ||||||||||
|---|---|---|---|---|---|---|---|---|---|---|---|
| Percenta | Shareb | Percenta | Shareb | ||||||||
| Antimicrobial | 2011 | 2016 | 2011 | 2016 | 2011 | 2016 | 2011 | 2016 | |||
| 2011 and 2016 Data | |||||||||||
| Noncombination ionophore | 91.5 | 49.9c | 35.77 | 30.33c | 90.1 | 47.9c | 46.3 | 33.24c | |||
| Bacitracin | 0 | 0 | 0 | 0 | 0 | 0 | 0 | 0 | |||
| Chlortetracycline | 71.7 | 63.7d | 28.03 | 38.72 | 18.4 | 23.7 | 9.46 | 16.45 | |||
| Chlortetracycline with sulfamethazine | 12.1 | 6.6 | 4.73 | 4.01 | 2.2 | 4.7 | 1.13 | 3.26 | |||
| Neomycin | 0.9 | 0.0e | 0.35 | 0 | 0.1 | 0 | 0.05 | 0 | |||
| Oxytetracycline | 7.5 | 3.2f | 2.93 | 1.95 | 0.5 | 0.8 | 0.26 | 0.56 | |||
| Sulfamethazine with sulfadimethoxine | 5.4 | 1.1g | 2.11 | 0.67 | 0.2 | 0 | 0.1 | 0 | |||
| Tetracycline | 1.2 | 0 | 0.47 | 0 | 0.1 | 0 | 0.05 | 0 | |||
| Tylosin | 31 | 39.0h | 12.12 | 23.71 | 71.2 | 66.5 | 36.59 | 46.15 | |||
| Virginiamycin | 0.5 | 0 | 0.2 | 0 | 0.2 | 0 | 0.1 | 0 | |||
| 2011 Antimicrobial Data Onlyi | |||||||||||
| Coccidiostats | 33.3 | - | 13.02 | - | 11.5 | - | 5.91 | - | |||
| Other | 0.7 | - | 0.27 | - | 0.1 | - | 0.05 | - | |||
| 2016 Antimicrobial Data Onlyi | |||||||||||
| Bambermycin | - | 0 | - | 0 | - | 0 | - | 0 | |||
| Monensin with Tilmicosin | - | 0.7 | - | 0.43 | - | 0.5 | - | 0.35 | |||
| Spectinomycin | - | 0 | - | 0 | - | 0 | - | 0 | |||
| Tilmicosin | - | 0.3 | - | 0.18 | - | 0 | - | 0 |
Source: NAHMS (2013, 2019) and author’s calculations.
Notes: aNumbers do not sum to 100 because individual feedlots can choose to use more than one type of feed and water antimicrobial; bShares were calculated by dividing the percent of each drug by the total sum of the percent column; c For 2016, when the noncombination ionophores and combination ionophores are summed, the share of feedlots (cattle) that used noncombination and combination ionophores was 54.04% (78.14%); dChlortetracycline includes only chlortetracycline, laidlomycin with chlortetracycline, and lasalocid with chlortetracycline; eNeomycin includes only neomycin and neomycin with oxytetracycline; fOxytetracycline includes only oxytetracycline and lasalocid with oxytetracycline; gSulfamethazine with sulfadimethoxine includes only sulfamethazine and only sulfadimethoxine; hTylosin includes only tylosin, lasalocid with tylosin, and monensin with tylosin; iProducers were not asked if they used this type of antimicrobial in the given year.
Figure 1.
[1] These are sales and not actual use.
Centers for Disease Control and Prevention. 2013. Antibiotic Resistance Threats in the United States, 2013. Washington, DC: U.S. Department of Health and Human Services. Available online at http://www.cdc.gov/drugresistance/threat-report-2013/index.html
World Health Organization. 2012. The Evolving Threat of Antimicrobial Resistance: Options for Action. Geneva, Switzerland: World Health Organization.
U.S. Department of Agriculture. 2013. Feedlot 2011. Part IV: Health and Health Management on U.S. Feedlots with a Capacity of 1,000 or More Head. Fort Collins, CO: U.S. Department of Agriculture, Animal and Plant Health Inspection Service, Veterinary Services, National Animal Health Monitoring System. Available online at http://www.aphis.usda.gov/animal_health/nahms/feedlot/downloads/feedlot2011/Feed11_dr_PartIV.pdf
U.S. Department of Agriculture. 2019. Antimicrobial Use and Stewardship on U.S. Feedlots. Fort Collins, CO: U.S. Department of Agriculture, Animal and Plant Health Inspection Service, Veterinary Services, National Animal Health Monitoring System. Available online at https://www.aphis.usda.gov/animal_health/nahms/amr/downloads/amu-feedlots_1.pdf
Landers, T. F., B. Cohen, T. E. Wittum, and E. L. Larson. 2012. “A Review of Antibiotic Use in Food Animals: Perspective, Policy, and Potential.” Public Health Reports 127 (1): 4–22. doi: 10.1177/003335491212700103.
Assistant Professor and Livestock Economist
Department of Agricultural Economics
University of Nebraska-Lincoln