Cornhusker Economics March 15, 2023
Nebraska Farmland Values and Cash Rental Rates in 2023
The market value of agricultural land in Nebraska increased by 14% over the prior year to an average of $3,835 per acre, according to the 2023 Nebraska Farm Real Estate Market Survey (Figure 1 and Table 1). This marks the second-largest increase in the market value of agricultural land in Nebraska since 2014 and the highest non-inflation-adjusted state-wide land value in the 45-year history of the survey.
Figure 1. Historic Nebraska Average Land Value, Selected Years 1978-2023a
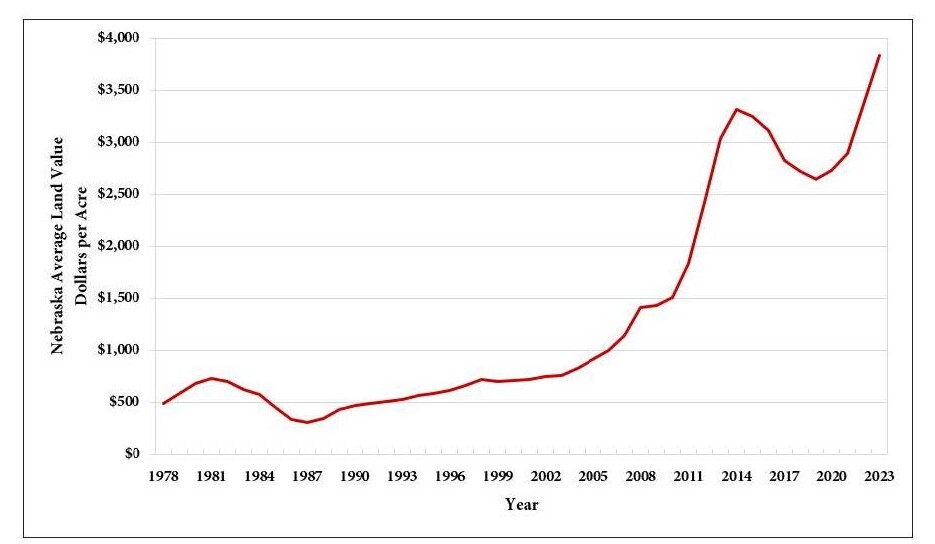
Source: aUNL Nebraska Farm Real Etstate Marker Surveys, 1978 - 2023
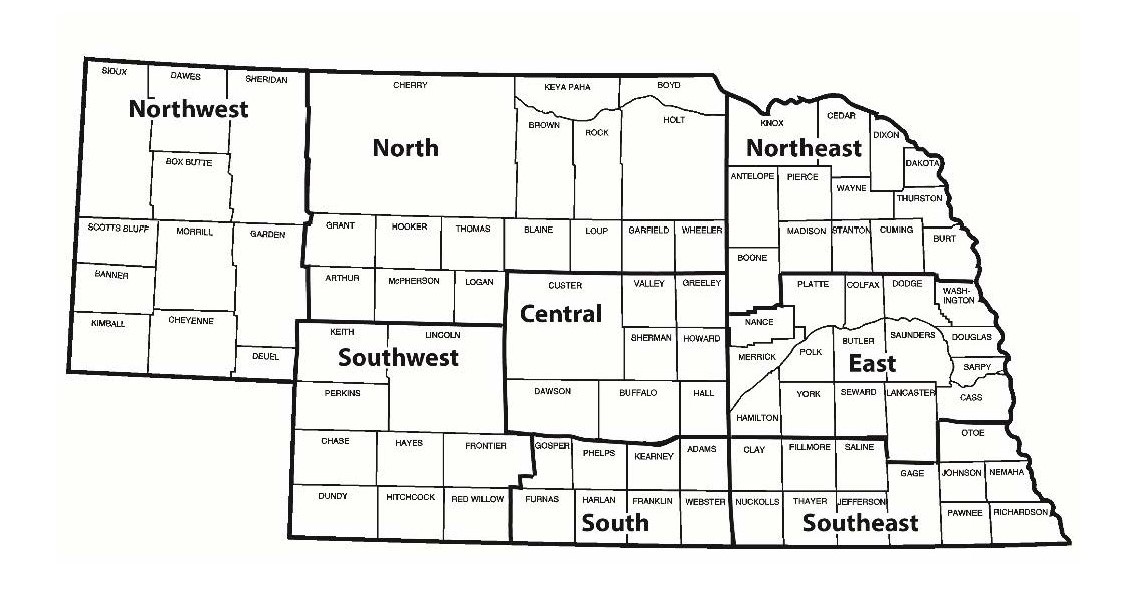
The University of Nebraska-Lincoln’s Department of Agricultural Economics annually surveys land industry professionals across Nebraska, including appraisers, farm and ranch managers, agricultural bankers, and related industry professionals. Results from the survey are divided by land class and summarized by the eight Agricultural Statistic Districts of Nebraska (Figure 2).
Figure 2: Nebraska Agricultural Statistics Districts
Land industry professionals responding to the annual survey attributed the rise in Nebraska agricultural real estate values to current crop and livestock prices, purchases for operation expansion, the financial health of current owners, and as a hedge against inflation. Rising commodity prices helped the financial position of many operations despite rising input expenses and drought concerns. As a tangible investment to hedge against inflation, many operators turned to agricultural land markets as long-term investments. Agricultural tractors and equipment also experienced a rise in market value as operators updated machinery lines.
Higher commodity prices led to a net farm income of approximately $8.033 billion in Nebraska for 2022. Farm expenses for fertilizer, fuel, and related inputs increased by $3.189 billion over the prior year but appear steady, with better availability for the upcoming production season. Forecasted estimates for Nebraska place net farm income in 2023 at about $7.956 billion (Lubben, 2023). The financial position of many operations improved as the working capital increased by 60% for the farm and ranch sector (Cowley & Kreitman, 2023). The financial position of many operations improved in 2022.
Rising interest rates matched higher net farm incomes to combat inflation. Early in 2022, record-low interest rates on agricultural loans rose to a decade high by the end of the year. The interest rate for agricultural real estate loans rose from about 4.5% to 7.2% across states in the Tenth District of the Federal Reserve Bank of Kansas City (Scott & Kreitman, 2023). Rising interest rates may impact agricultural real estate markets without additional profitability to offset the rising financing expense.
Favorable financial positions and inflationary concerns left many operations acquiring tangible assets to hedge their purchasing power. Operators and investors use land purchases to navigate inflation and grow farms or ranches. Related agricultural assets such as tractors, machinery, and transportation equipment followed similar trends as operations faced rising expenses in acquiring production assets. Survey participants reported that these underlying financial forces guided the agricultural real estate markets.
Compared to the prior year, the estimated market value of dryland cropland without irrigation potential rose by 13% across the state (Table 1). Districts in the Northwest, South, and Southeast increased by 15% to 21%. Average increases in the other five districts ranged from 7% to 13%. Dryland cropland with irrigation potential rose 16% for the state. Districts in the Northeast, Southwest, and Southeast reported increases ranging from 17% to 21%, whereas the other regions reported increases ranging from 5% to 15%. Water use policies guide the new development of irrigated cropland.
Center pivot irrigated cropland averaged 13% higher over 2022, with the Northeast, East, and Southeast leading Nebraska from 14% to 19%. The Central and Southwest reported a gain of 10% and 12%, while the Northwest, North, and South rose between 4% to 8%. Higher commodity prices also carried into gravity irrigated cropland average 12% higher in 2023. The East and South gains were between 14% and 20% higher. Drought conditions across significant irrigation regions of the state, coupled with strong commodity prices, led to the robust demand for the highest-valued land classes.
The gain in the grazing land and hayland market value ranged from 14% to 17%. Hayland led the three land classes at 17% as operators competed for additional acres during expansive drought across the state. Nontillable grazing land followed hayland with an increase of 15%. Major grazing regions in the Northwest, North, Central, and Southwest led the gains ranging from 13% to 20%. Cow-calf producers competed for grazing properties during the extensive drought. Tillable grazing land also trended higher at 14% across the state.
Dryland and irrigated cropland rental rates trended higher across Nebraska in 2023 (Table 2). Survey responses indicated current crop prices as a major driving force leading to the reported changes in rental rates. Overseas conflicts and drought across significant grain-producing regions have disrupted trade patterns. Current grain prices allow producers to ensure a greater level of revenue through crop insurance but face higher premiums and input expenses. Seed, fertilizer, and chemical prices will remain elevated in 2023. Flexible lease provisions help mitigate price uncertainty and production risk in cash rents paid across Nebraska.
Cash rental rates for dryland cropland rose about 7% to 11% higher than the prior growing season. The irrigated cropland cash rental rates assume the landlord owns the entire irrigation system. In cases where a tenant provides a component of the irrigation system, the rental rate would be adjusted lower to reflect the contribution. Challenges surrounding drought, input expenses, and water availability were concerns expressed by survey participants for the upcoming growing season. Accounting for actual revenue and production expenses in a flexible lease arrangement might be one feature to consider for 2023.
Pasture and cow-calf pair rental rates trended steady to higher across Nebraska in 2023 (Table 2). These rates rose about 6% to 7% over the prior grazing season. Extensive drought in major grazing land areas poses a threat without additional rainfall in the upcoming growing season. The cash rental negotiations should include early removal provisions when accounting for drought considerations.
The degree of service the landlord or tenant provides influences the cow-calf pair rental rates paid as part of the lease. Considerations for the leases include the party responsible for fencing upkeep, control of noxious weeds or brush, and payment of utility bills (used for livestock wells). As shown in Table 2, the high third quality for cash rent may reflect some of these negotiated lease provisions.
Land values and rental rates presented in this report are averages of survey participants’ responses by district. Actual land values and rental rates may vary depending on the quality of the parcel and the local market for an area. Also, preliminary land values and rental rates are subject to change with the return of additional surveys. Final results from the survey will be published in June 2023 and available online via the Nebraska Farm Real Estate website: http://cap.unl.edu/realestate.
Please address questions regarding preliminary estimates from the 2023 Nebraska Farm Real Estate Survey to Jim Jansen at (402) 261-7572 or jjansen4@unl.edu.
| Type of Land and Year | Agricultural Statistics District | ||||||||
|---|---|---|---|---|---|---|---|---|---|
| Northwest | North | Northeast | Central | East | Southwest | South | Southeast | Statec | |
| - - - - - - - - - - - - - - - - - - - - - - - - - - - - - Dollars Per Acre - - - - - - - - - - - - - - - - - - - - - - - - - - - | |||||||||
| Dryland Cropland (No Irrigation Potential) | |||||||||
| $/acre | 905 | 1,960 | 7,845 | 3,830 | 8,365 | 1,720 | 3,990 | 6,425 | 4,395 |
| % Change | 21 | 7 | 13 | 8 | 11 | 10 | 15 | 17 | 13 |
| Dryland Cropland (Irrigation Potential) | |||||||||
| $/acre | 985 | 2,365 | 8,890 | 4,255 | 9,535 | 2,080 | 4,535 | 8,110 | 6,070 |
| % Change | 15 | 5 | 19 | 10 | 13 | 17 | 9 | 21 | 16 |
| Grazing Land (Tillable) | |||||||||
| $/acre | 735 | 1,550 | 4,185 | 2,620 | 4,615 | 1,150 | 2,595 | 3,460 | 1,680 |
| % Change | 18 | 13 | 15 | 21 | 18 | 9 | 13 | 6 | 14 |
| Grazing Land (Nontillable) | |||||||||
| $/acre | 575 | 870 | 2,695 | 2,030 | 2,865 | 945 | 1,685 | 2,750 | 1,090 |
| % Change | 13 | 17 | 9 | 20 | 5 | 15 | 7 | 10 | 15 |
| Hayland | |||||||||
| $/acre | 930 | 1,680 | 3,845 | 2,610 | 3,980 | 1,755 | 2,270 | 3,695 | 2,210 |
| % Change | 12 | 23 | 11 | 17 | 15 | 14 | 9 | 18 | 17 |
| Gravity Irrigated Cropland | |||||||||
| $/acre | 2,760 | 4,455 | 9,800 | 7,235 | 11,290 | 4,350 | 7,820 | 8,485 | 7,905 |
| % Change | 10 | 6 | 9 | 3 | 20 | 5 | 14 | 11 | 12 |
| Center Pivot Irrigated Croplandb | |||||||||
| $/acre | 3,280 | 5,065 | 11,710 | 8,890 | 12,970 | 5,495 | 8,370 | 11,415 | 8,760 |
| % Change | 7 | 4 | 16 | 10 | 19 | 12 | 8 | 14 | 13 |
| All Land Averagec | |||||||||
| $/acre | 935 | 1,450 | 8,035 | 4,210 | 9,320 | 2,025 | 4,850 | 7,090 | 3,835 |
| % Change | 13 | 12 | 16 | 10 | 15 | 12 | 11 | 17 | 14 |
bValue of pivot not included in per acre value.
cWeighted averages.
| Type of Land | Agricultural Statistics District | |||||||
| Northwest | North | Northeast | Central | East | Southwest | South | Southeast | |
| Dollars Per Acre | ||||||||
| Dryland Cropland | ||||||||
| Average | 37 | 76 | 265 | 135 | 245 | 56 | 115 | 200 |
| % Change | 10 | 17 | 9 | 12 | 4 | 13 | 15 | 5 |
| High Third Quality | 49 | 105 | 315 | 160 | 285 | 74 | 140 | 245 |
| Low Third Quality | 28 | 55 | 205 | 110 | 205 | 45 | 89 | 165 |
| Gravity Irrigated Cropland | ||||||||
| Average | 145 | 210 | 315 | 270 | 305 | 195 | 260 | 290 |
| % Change | 12 | 8 | 5 | 10 | 7 | 9 | 6 | 11 |
| High Third Quality | 185 | 245 | 370 | 310 | 335 | 235 | 295 | 330 |
| Low Third Quality | 110 | 180 | 265 | 215 | 260 | 165 | 225 | 245 |
| Center Pivot Irrigated Croplandb | ||||||||
| Average | 190 | 240 | 365 | 305 | 345 | 230 | 315 | 335 |
| % Change | 9 | 5 | 7 | 11 | 5 | 2 | 13 | 6 |
| High Third Quality | 230 | 285 | 410 | 350 | 385 | 275 | 355 | 370 |
| Low Third Quality | 155 | 195 | 315 | 245 | 295 | 190 | 260 | 290 |
| Pasture | ||||||||
| Average | 15 | 33 | 72 | 46 | 60 | 26 | 41 | 56 |
| % Change | 7 | 10 | 4 | 13 | 9 | 6 | 2 | 5 |
| High Third Quality | 20 | 46 | 95 | 59 | 73 | 34 | 55 | 71 |
| Low Third Quality | 13 | 18 | 53 | 37 | 48 | 21 | 29 | 45 |
| Dollars Per Month | ||||||||
| Cow-Calf Pair Monthly Ratesc | ||||||||
| Average | 46.05 | 69.80 | 67.35 | 66.70 | 62.55 | 58.60 | 56.85 | 60.20 |
| % Change | 7 | 4 | 2 | 9 | 7 | 3 | 11 | 5 |
| High Third Quality | 51.95 | 78.50 | 76.45 | 75.25 | 71.40 | 63.75 | 65.30 | 70.55 |
| Low Third Quality | 38.15 | 59,65 | 54.70 | 53.90 | 55.05 | 50.45 | 45.80 | 48.60 |
bCash rents on center pivot land assumes landowners own total irrigation system.
cA cow-calf pair is typically considered to be 1.25 to 1.30 animal units (animal unit being 1,000 lb. animal) for a five-month grazing season. However, this can vary depending on weight of cow and age of calf.
Jim Jansen, (402) 261-7572
Agricultural Economist
University of Nebraska-Lincoln
jjansen4@unl.edu
Jeffrey Stokes, (402) 472-2127
Professor of Agricultural Economics
University of Nebraska-Lincoln
jeffrey.stokes@unl.edu
References
Cowley, C., & Kreitman, T. (2023, January 18). Rebound in Farm Lending Continues, retrieved March 6, 2023, from the Kansas City FED.
Lubben, B. (2022, October 3) Fall 2022 Nebraska Farm Income Outlook, retrieved March 6, 2023 from the UNL Bureau of Business Research.
Scott, F., & Kreitman, T. (2023, February 17). Growth in Farmland Value Continues, but Higher Rates Temper the Outlook, retrieved March 7, 2023, from the Kansas City FED.