Cornhusker Economics July 8, 2015Trends in Satisfaction with Jobs and Finances: Observations from Nineteen Years of the Nebraska Rural Poll
The Nebraska Rural Poll has been conducted every year since 1996 and has dealt with many topics of concern to non-metropolitan Nebraskans. While important and sometimes controversial topics such as water resources, taxation and climate change draw the interest of the media, another set of questions often go largely unnoticed by readers. Those questions, many repeated in every Poll, inquire as to the respondents' level of "satisfaction" with an array of community amenities, such as infrastructure, environment, services and leadership. Other repeated Poll questions deal with the respondents' level of satisfaction with their current personal or household situation, including such items as employment and income.
With nineteen years of such observations available (year 20 is currently being analyzed), the Rural Poll offers an opportunity to examine trends that might be occurring in how non-metropolitan Nebraskans rate the condition of their communities and their lives. In this paper, we will explore trends in reported satisfaction for four variables: Jobs, job security, income, and financial security during retirement. Depending upon the question, the total sample size for these four variables ranges between 39,000 and 50,000, averaging between 2,000 and 2,500 observations for each year.
Despite the relatively large sample size, the Rural Poll is not a perfect representation of Nebraska's non-metropolitan residents. Response rates for the Poll have varied between 29 and 67 percent, good by social survey standards but still leaving substantial room for sampling error. Each year, Rural Poll demographic data are compared to corresponding Census data in order to identify populations that are either over-represented or under-represented among respondents. In general, the Poll tends to be a good demographic match with the exception of under-representation by the youngest respondents. For that reason, responses received from those age 19 to 29 are statistically weighted. In the end, based upon the assumption that errors in the sample are random, the Rural Poll is able to claim accuracy of between 2 percent and 3 percent, depending upon the year.
The questions examined here come from a list of 23 items that are prefaced with the instruction: "Please indicate how satisfied you are with each of the following." Respondents are directed to respond on a five-point scale ranging from "Very dissatisfied" to "Very satisfied" with an option to indicate "No opinion." In each of the figures below the percentage of respondents assigning one of the two highest satisfaction scores to a particular item (i.e. satisfied to very satisfied) is tracked over all 19 years of the Poll.
Figure 1 depicts reported satisfaction with "Your (e.g. the respondent's) job." In this case, respondents for whom the question is not applicable due to retirement, disability, student, or some other status are excluded from the analysis.
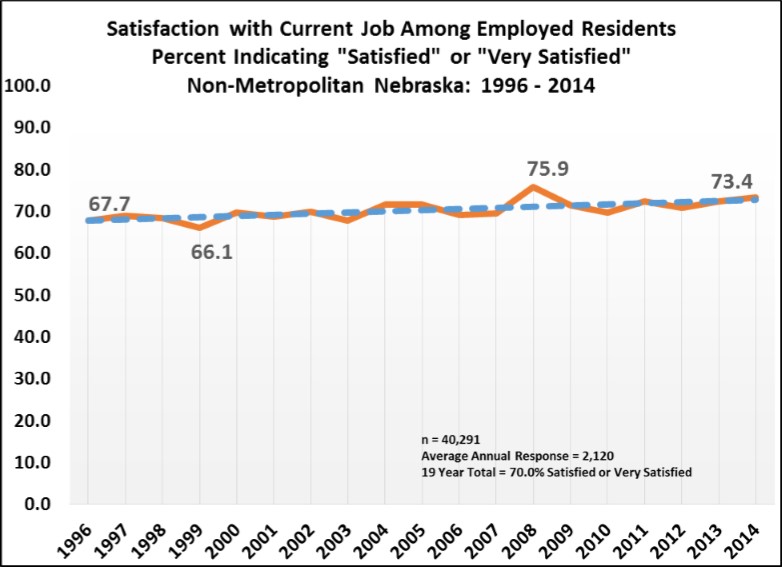
The first observation to be found in these data is that employed non-metropolitan Nebraskans tend to be relatively satisfied with their jobs. The percentage of respondents indicating that they are satisfied or very satisfied with their current job has ranged from a low of 66.1 percent (1999) to a high of 75.9 percent in 2008. Adding a trendline to the data indicates that reported satisfaction with one's job has tended to increase over time, albeit slowly.
The reader may note that, as a recession year, 2008 is a particularly interesting point at which to see the Poll record its highest rate of reported job satisfaction. One could speculate that, given the highly publicized effects of that recession in other parts of the country, non-metropolitan Nebraskans with jobs were satisfied just to be employed at all. Of course, as noted earlier, those responses may also be the result of sampling or reporting error and one can have more confidence in the long-term trend.
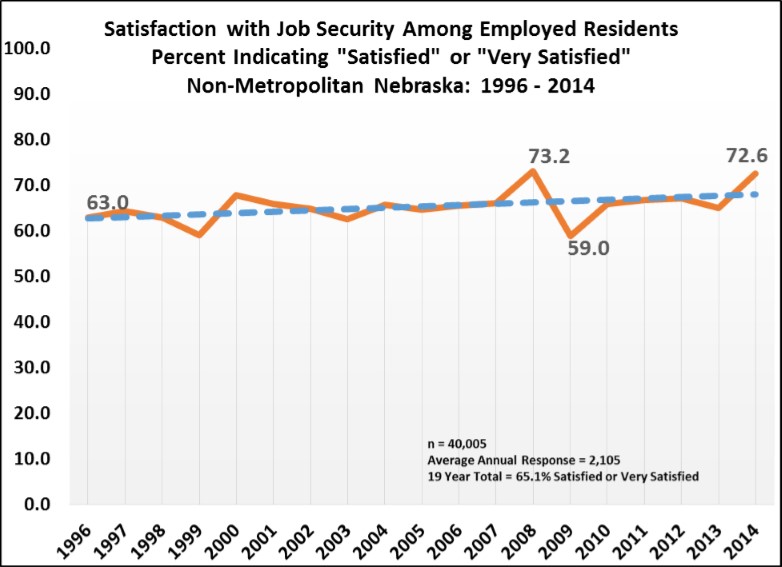
As seen in Figure 2, a majority of employed non-metropolitan Nebraskans also indicate satisfaction with their job security. Again, the trend appears to be toward a growing percentage of the population reporting such satisfaction. The percentage of respondents indicating that they were satisfied or very satisfied with their job security has grown from 63 percent to 72.6 percent over the life of the Poll. As in the case of jobs, 2009 emerges as a particularly interesting year. In this case, that was the year in which the Poll's lowest level of satisfaction with job security was recorded. As before, one might suspect that recession concerns played into that perception among respondents.
Respondents have been less likely to report satisfaction with their income. That variable has also demonstrated considerable variation over the years. As seen in Figure 3, the percentage of respondents (without regard to employment status) indicating that they were satisfied or very satisfied with their income has varied from a high of 57.5 percent in 1997 to a low of 46.8 percent in 2003. In 2014, the last completed year of the Rural Poll, 54.9 percent of respondents indicated that they were satisfied or very satisfied with their income. This is almost identical to data from the poll's first year. The trend for reported satisfaction with income appears to be essentially flat or very slightly upward.
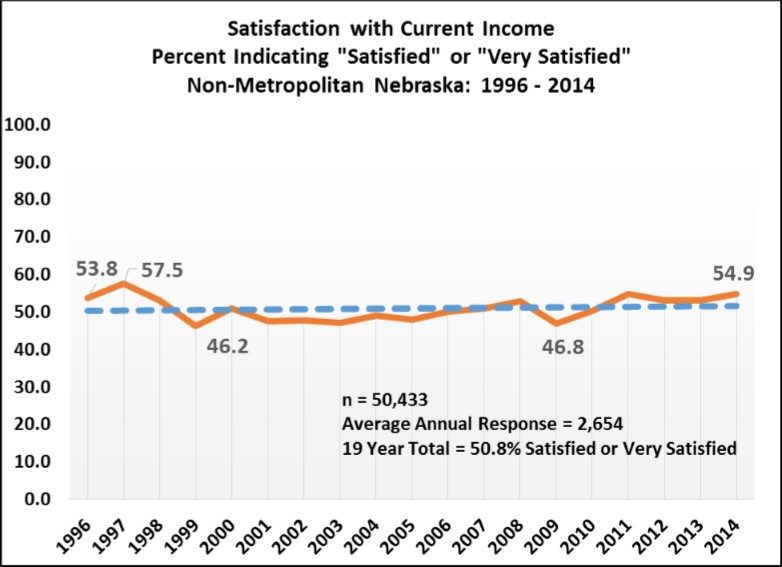
The year 2009 did see a decline in satisfaction with income, perhaps owing to diminished hours or lost self-employment income during the period of recession. However, the decline from 52.8 percent to 46.6 percent is not is not particularly large, falling just outside of the Poll's estimate of error.
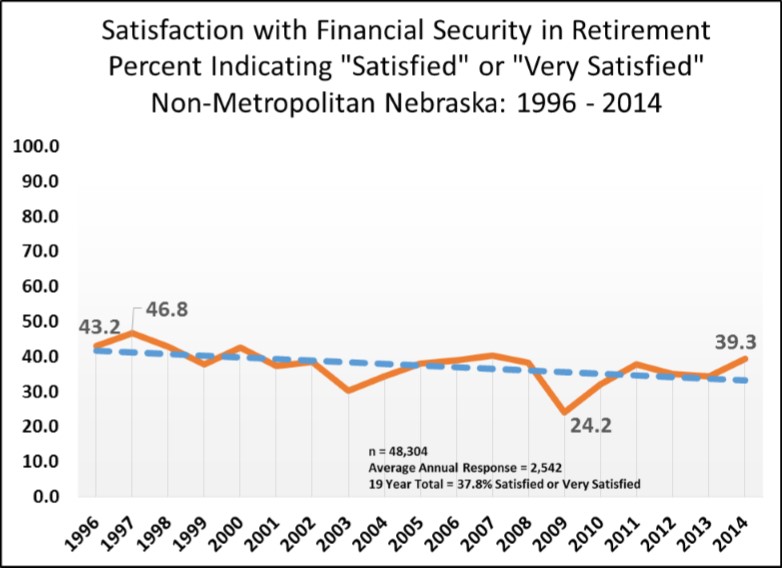
Finally, Figure 4 depicts the percentage of respondents indicating that they were either satisfied or very satisfied with their "Financial security during retirement." Unlike the other variables examined, respondents indicating that they are satisfied or very satisfied with their financial security in retirement do not constitute a majority of all respondents. The percentage of satisfied respondents ranges from a high of 46.8 percent in 1997 (the year that also found the highest level of satisfaction with income) to a low of 24.2 percent during the recession year of 2009. Moreover, the trend in satisfaction with this item appears to be downward over the life of the Poll. Concerns over finances during retirement thus appears to be problematic for many non-metropolitan Nebraskans. This is hardly surprising since we all seem to be constantly reminded that we are probably not saving enough money to enable a comfortable retirement.
Beyond tracking changes in opinion over time, these Rural Poll data suggest a number of analyses that might help us to better understand what influences those opinions. The size of the database offers the potential of examining variation in opinion in relation to demographic variables such as age, education, and actual income. It will also be possible to examine what if any relationship exists between respondent opinions and actual conditions at the local level, such as changes in job numbers or income.
To learn more about the Nebraska Rural Poll, visit the website: ruralpoll.unl.edu. There you will find all of the reports prepared since 1996, indexed by year and topic.
Randy Cantrell, (402) 472-0919
University of Nebraska Rural Initiative
University of Nebraska-Lincoln
rcantrell1@unl.edu