Download Report
Highlights
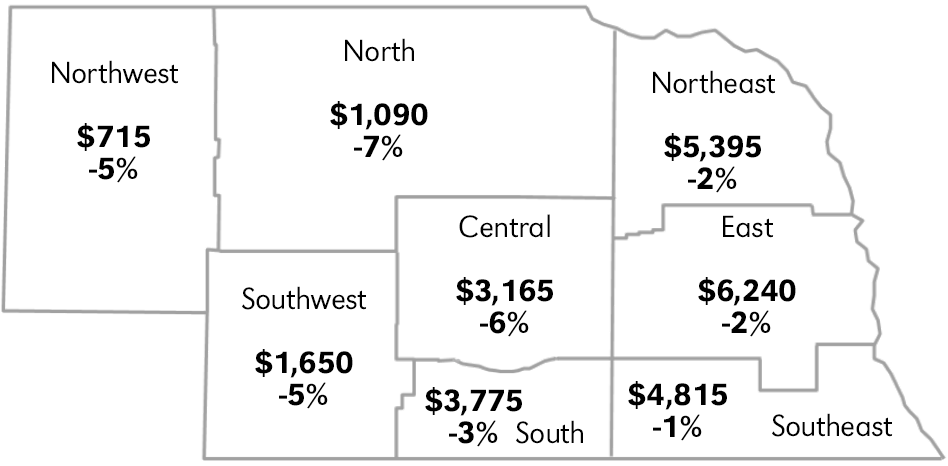
- Average land value changes by district varied from a 7 percent reduction in the North to 1 percent in the Southeast.
- Tillable grazing land saw the greatest decline of 7 percent. The changes were particularly notable in the East and Central districts where values dropped 11 and 10 percent, respectively. However, tillable grazing land in the Southeast district was an exception and increased 2 percent.
- Two other categories, dryland cropland with no irrigation potential in the Northeast and nontillable grazing land in the Southeast, were the only others to see an increase.
- Survey participants identified crop prices and property tax levels as significantly contributing to the drop in land values.
Average Value of Nebraska Farmland, February 1, 2018 and Percent Change From Year Earlier
State
| Land Type | $/Acre | % Change |
|---|---|---|
|
All Land Average |
2,720 | -4 |
|
Center Pivot Irrigated Cropland |
6,130 | -3 |
|
Gravity Irrigated Cropland |
5,795 | -5 |
|
Dryland Cropland (Irrigation Potential) |
4,115 | -3 |
|
Dryland Cropland (No Irrigation Potential) |
3,100 | -1 |
|
Grazing Land (Tillable) |
1,250 | -6 |
|
Grazing Land (Nontillable) |
835 | -7 |
|
Hayland |
1,710 | -6 |
Northwest
| Land Type | $/Acre | % Change |
|---|---|---|
|
All Land Average |
715 | -5 |
|
Center Pivot Irrigated Cropland |
2,700 | -4 |
|
Gravity Irrigated Cropland |
2,340 | -9 |
|
Dryland Cropland (Irrigation Potential) |
730 | -5 |
|
Dryland Cropland (No Irrigation Potential) |
670 | -6 |
|
Grazing Land (Tillable) |
510 | -6 |
|
Grazing Land (Nontillable) |
435 | -6 |
|
Hayland |
765 | -4 |
Counties:
Banner
Box Butte
Cheyenne
Dawes
Deuel
Garden
Kimball
Morrill
Scotts Bluff
Sheridan
Sioux
North
Counties
Arthur
Blaine
Boyd
Brown
Cherry
Garfield
Grant
Holt
Hooker
Keya Paha
Logan
Loup
McPherson
Rock
Thomas
Wheeler
Northeast
Counties:
Antelope
Boone
Burt
Cedar
Cuming
Dakota
Dixon
Knox
Madison
Pierce
Platte
Stanton
Thurston
Wayne
Central
Counties
Buffalo
Custer
Dawson
Greeley
Hall
Howard
Sherman
Valley
East
Counties
Butler
Cass
Colfax
Dodge
Douglas
Hamilton
Lancaster
Merrick
Nance
Polk
Sarpy
Saunders
Seward
Washington
York
Southwest
Counties
Chase
Dundy
Frontier
Hayes
Hitchcock
Keith
Lincoln
Perkins
Red Willow
South
Counties
Adams
Franklin
Furnas
Gosper
Harlan
Kearney
Phelps
Webster
Southeast
| Land Type | $/Acre | % Change |
|---|---|---|
|
All Land Average |
4,815 | -1 |
|
Center Pivot Irrigated Cropland |
7,720 | -1 |
|
Gravity Irrigated Cropland |
6,295 | -5 |
|
Dryland Cropland (Irrigation Potential) |
5,345 | -1 |
|
Dryland Cropland (No Irrigation Potential) |
4,205 | -2 |
|
Grazing Land (Tillable) |
2845 | 2 |
|
Grazing Land (Nontillable) |
2,045 | 2 |
|
Hayland |
2,615 | -2 |
Counties
Clay
Fillmore
Gage
Jefferson
Johnson
Nemaha
Nuckolls
Otoe
Pawnee
Richardson
Saline
Thayer
| Type of Land | Northwest | North | Northeast | Central | East | Southwest | South | Southeast |
|---|---|---|---|---|---|---|---|---|
| Dryland Cropland | ||||||||
| Average | 28 | 53 | 210 | 89 | 190 | 41 | 76 | 160 |
| % Change | -3 | -4 | -2 | 1 | -3 | 5 | 6 | 3 |
| High Third Quality | 42 | 87 | 255 | 115 | 230 | 56 | 100 | 205 |
| Low Third Quality | 21 | 28 | 175 | 72 | 150 | 35 | 53 | 125 |
| Gravity Irrigated Cropland | ||||||||
| Average | 115 | 170 | 250 | 205 | 255 | 165 | 200 | 225 |
| % Change | -4 | 3 | -2 | -7 | -2 | -3 | -2 | -4 |
| High Third Quality | 140 | 200 | 285 | 235 | 300 | 200 | 245 | 265 |
| Low Third Quality | 96 | 130 | 220 | 175 | 220 | 130 | 175 | 200 |
| Center Pivot Irrigated Croplanda | ||||||||
| Average | 150 | 200 | 290 | 220 | 280 | 190 | 215 | 260 |
| % Change | -3 | -2 | -5 | -4 | -3 | -5 | -4 | -2 |
| High Third Quality | 190 | 240 | 330 | 255 | 315 | 215 | 255 | 310 |
| Low Third Quality | 115 | 145 | 245 | 195 | 245 | 165 | 180 | 215 |
| Pasture | ||||||||
| Average | 10 | 26 | 61 | 33 | 49 | 21 | 36 | 47 |
| % Change | -5 | 2 | -2 | -3 | -8 | -5 | 1 | -4 |
| High Third Quality | 19 | 37 | 82 | 47 | 74 | 28 | 45 | 66 |
| Low Third Quality | 7 | 15 | 48 | 29 | 38 | 17 | 23 | 38 |
a Cash rents on center pivot land assumes landowners own total irrigation system.
Due to the inherent limitations of this survey, information in this report should not be used to set a specific rental rate or value a particular parcel of real property for sale or property taxes, security for a loan, and other related legal matters.