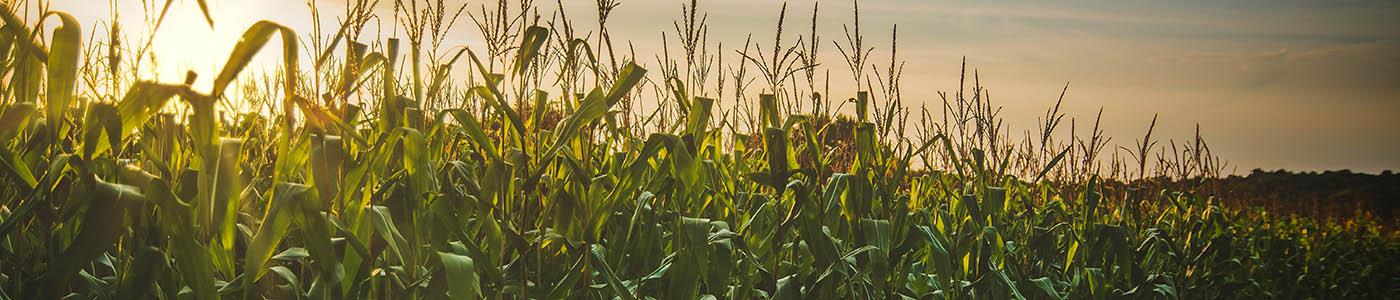
The all-land average value in Nebraska for the year ending February 1, 2019 averaged about 3 percent lower than the year before. This marks five consecutive years of declining land values.
The state average was $2,645 per acre or about a $75 per acre decline to the prior year’s value of $2,720 per acre.
Download Full Report
The state average was $2,645 per acre or about a $75 per acre decline to the prior year’s value of $2,720 per acre.
Download Full Report
Highlights
- Rates of decline were lower in the eastern third and central region of Nebraska compared to the western two-thirds of the state.
- In the western regions of Nebraska, including the Northwest, North, Southwest, and South Districts these areas averaged from 4 to 6 percent lower for the all-land average. The Northeast, Central, East, South, and Southwest Districts declined slightly from 1 to 3 percent.
- Panel members reported in 2019 current crop prices, property tax levels and farm input costs as the most negative forces leading to the lower market value of land across.
- Based on 2019 market values, the estimated total value of agricultural land and buildings in Nebraska fell to approximately $125.3 billion. Between 2018 and 2019, the market value decline in agricultural land and building totaled about $3.6 billion.

| Land Type | $/Acre | %Change |
|---|---|---|
| All Land Average | 2,645 | -3 |
| Center Pivot Irrigated Cropland | 5,970 | -3 |
| Gravity Irrigated Cropland | 5,690 | -2 |
| Dryland Cropland (Irrigation Potential) | 4,010 | -3 |
| Dryland Cropland (No Irrigation Potential) | 3,040 | -2 |
| Grazing Land (Tillable) | 1,185 | -5 |
| Grazing Land (Nontillable) | 795 | -5 |
| Hayland | 1,615 | -6 |
Due to the inherent limitations of this survey, the information in this report should not be used to set a specific rental rate or value a particular parcel of real property for sale or property taxes, security for a loan, and other related legal matters.
Central
| Land Type | $/Acre | % Change |
|---|---|---|
| All Land Average | 3,090 | -2 |
| Center Pivot Irrigated Cropland | 6,390 | -2 |
| Gravity Irrigated Cropland | 5,860 | 1 |
| Dryland Cropland (Irrigation Potential) | 3,055 | -1 |
| Dryland Cropland (No Irrigation Potential) | 2,755 | 1 |
| Grazing Land (Tillable) | 1,750 | -10 |
| Grazing Land (Nontillable) | 1,405 | -9 |
| Hayland | 1,885 | -5 |
| Land Type | $/Acre | % Change |
|---|---|---|
| Center Pivot Irrigated Cropland | 215 | -2 |
| Gravity Irrigated Cropland | 195 | -5 |
| Dryland Cropland | 84 | -5 |
| Pasture | 31 | -5 |
| Land Type | $/Month |
|---|---|
| Cow-Calf Pairs | 50.70 |
| Stockers | 30.85 |
Counties: Buffalo, Custer, Dawson, Greeley, Hall, Howard, Sherman, Valley
East
| Land Type | $/Acre | % Change |
|---|---|---|
| All Land Average | 6,185 | -1 |
| Center Pivot Irrigated Cropland | 8,485 | -2 |
| Gravity Irrigated Cropland | 7,585 | 2 |
| Dryland Cropland (Irrigation Potential) | 6,145 | -2 |
| Dryland Cropland (No Irrigation Potential) | 5,765 | 2 |
| Grazing Land (Tillable) | 3,075 | -8 |
| Grazing Land (Nontillable) | 2,255 | -4 |
| Hayland | 3,040 | 2 |
| Land Type | $/Acre | % Change |
|---|---|---|
| Center Pivot Irrigated Cropland | 285 | 2 |
| Gravity Irrigated Cropland | 245 | -4 |
| Dryland Cropland | 200 | 5 |
| Pasture | 47 | -3 |
| Land Type | $/Month |
|---|---|
| Cow-Calf Pairs | 49.15 |
| Stockers | 36.05 |
Counties: Butler, Cass, Colfax, Dodge, Douglas, Hamilton, Lancaster, Merrick, Nance, Polk, Sarpy, Saunders, Seward, Washington, York
North
| Land Type | $/Acre | % Change |
|---|---|---|
| All Land Average | 1,050 | -4 |
| Center Pivot Irrigated Cropland | 3,905 | -3 |
| Gravity Irrigated Cropland | 3,570 | -2 |
| Dryland Cropland (Irrigation Potential) | 1,915 | -4 |
| Dryland Cropland (No Irrigation Potential) | 1,495 | -1 |
| Grazing Land (Tillable) | 1,040 | -3 |
| Grazing Land (Nontillable) | 625 | -2 |
| Hayland | 1,140 | -10 |
| Land Type | $/Acre | % Change |
|---|---|---|
| Center Pivot Irrigated Cropland | 185 | -8 |
| Gravity Irrigated Cropland | 165 | -3 |
| Dryland Cropland | 50 | -6 |
| Pasture | 24 | -6 |
| Land Type | $/Month |
|---|---|
| Cow-Calf Pairs | 57.50 |
| Stockers | 33.55 |
Counties: Arthur, Blaine, Boyd, Brown, Cherry, Garfield, Grant, Holt, Hooker, Keya Paha, Logan, Loup, McPherson, Rock, Thomas, Wheeler
Northeast
| Land Type | $/Acre | % Change |
|---|---|---|
| All Land Average | 5,230 | -3 |
| Center Pivot Irrigated Cropland | 7,210 | -1 |
| Gravity Irrigated Cropland | 6,510 | -3 |
| Dryland Cropland (Irrigation Potential) | 5,640 | -4 |
| Dryland Cropland (No Irrigation Potential) | 5,300 | -3 |
| Grazing Land (Tillable) | 3,125 | -6 |
| Grazing Land (Nontillable) | 1,995 | -7 |
| Hayland | 3,020 | -4 |
| Land Type | $/Acre | % Change |
|---|---|---|
| Center Pivot Irrigated Cropland | 280 | -3 |
| Gravity Irrigated Cropland | 255 | -2 |
| Dryland Cropland | 205 | -2 |
| Pasture | 59 | -4 |
| Land Type | $/Month |
|---|---|
| Cow-Calf Pairs | 54.90 |
| Stockers | 37.40 |
Counties: Antelope, Boone, Burt, Cedar, Cuming, Dakota, Dixon, Knox, Madison, Pierce, Stanton, Thurston, Wayne
Northwest
| Land Type | $/Acre | % Change |
|---|---|---|
| All Land Average | 680 | -5 |
| Center Pivot Irrigated Cropland | 2,565 | -5 |
| Gravity Irrigated Cropland | 2,245 | -4 |
| Dryland Cropland (Irrigation Potential) | 680 | -7 |
| Dryland Cropland (No Irrigation Potential) | 645 | -4 |
| Grazing Land (Tillable) | 500 | -2 |
| Grazing Land (Nontillable) | 410 | -6 |
| Hayland | 710 | -7 |
| Land Type | $/Acre | % Change |
|---|---|---|
| Center Pivot Irrigated Cropland | 145 | -3 |
| Gravity Irrigated Cropland | 110 | -4 |
| Dryland Cropland | 27 | -4 |
| Pasture | 11 | 1 |
| Land Type | $/Month |
|---|---|
| Cow-Calf Pairs | 36.15 |
| Stockers | 22.80 |
Counties: Banner, Box Butte, Cheyenne, Dawes, Deuel, Garden, Kimball, Morrill, Scotts Bluff, Sheridan, Sioux
South
| Land Type | $/Acre | % Change |
|---|---|---|
| All Land Average | 3,535 | -6 |
| Center Pivot Irrigated Cropland | 6,150 | -6 |
| Gravity Irrigated Cropland | 5,365 | -7 |
| Dryland Cropland (Irrigation Potential) | 3,450 | -5 |
| Dryland Cropland (No Irrigation Potential) | 2,880 | -3 |
| Grazing Land (Tillable) | 1,875 | -4 |
| Grazing Land (Nontillable) | 1,335 | -9 |
| Hayland | 1,990 | -3 |
| Land Type | $/Acre | % Change |
|---|---|---|
| Center Pivot Irrigated Cropland | 205 | -5 |
| Gravity Irrigated Cropland | 190 | -5 |
| Dryland Cropland | 73 | -4 |
| Pasture | 34 | -5 |
| Land Type | $/Month |
|---|---|
| Cow-Calf Pairs | 44.10 |
| Stockers | 31.30 |
Counties: Adams, Franklin, Furnas, Gosper, Harlan, Kearney, Phelps, Webster
Southeast
| Land Type | $/Acre | % Change |
|---|---|---|
| All Land Average | 4,700 | -2 |
| Center Pivot Irrigated Cropland | 7,470 | -3 |
| Gravity Irrigated Cropland | 5,900 | -6 |
| Dryland Cropland (Irrigation Potential) | 5,265 | -1 |
| Dryland Cropland (No Irrigation Potential) | 4,130 | -2 |
| Grazing Land (Tillable) | 2,760 | -3 |
| Grazing Land (Nontillable) | 1,970 | -4 |
| Hayland | 2,645 | 1 |
| Land Type | $/Acre | % Change |
|---|---|---|
| Center Pivot Irrigated Cropland | 250 | -4 |
| Gravity Irrigated Cropland | 220 | -2 |
| Dryland Cropland | 155 | -3 |
| Pasture | 46 | -1 |
| Land Type | $/Month |
|---|---|
| Cow-Calf Pairs | 45.15 |
| Stockers | 35.25 |
Counties: Clay, Fillmore, Gage, Jefferson, Johnson, Nemaha, Nuckolls, Otoe, Pawnee, Richardson, Saline, Thayer
Southwest
| Land Type | $/Acre | % Change |
|---|---|---|
| All Land Average | 1,565 | -5 |
| Center Pivot Irrigated Cropland | 4,110 | -4 |
| Gravity Irrigated Cropland | 3,700 | -5 |
| Dryland Cropland (Irrigation Potential) | 1,585 | -3 |
| Dryland Cropland (No Irrigation Potential) | 1,445 | -9 |
| Grazing Land (Tillable) | 880 | -7 |
| Grazing Land (Nontillable) | 735 | -6 |
| Hayland | 1,255 | -8 |
| Land Type | $/Acre | % Change |
|---|---|---|
| Center Pivot Irrigated Cropland | 175 | -8 |
| Gravity Irrigated Cropland | 155 | -6 |
| Dryland Cropland | 38 | -7 |
| Pasture | 19 | -7 |
| Land Type | $/Month |
|---|---|
| Cow-Calf Pairs | 46.35 |
| Stockers | 34.65 |
Counties: Chase, Dundy, Frontier, Hayes, Hitchcock, Keith, Lincoln, Perkins, Red Willow
Topic: