Cornhusker Economics July 14, 2014Recession and Recovery Jobs in Nebraska: 2008 to 2012
A commonly used resource for tracking changes in jobs and income at the county level is the Regional Economic Information System (REIS) data base produced annually by the Bureau of Economic Analysis (BEA).
REIS data are derived from tax filings by employers, employees and the self-employed. The data base has been relatively unchanged (except for a reorganization of industry codes) since 1969. Reporting is always for the tax year two-years previous to the release date, so the data are more about historical than current conditions. However, REIS is generally seen as reliable and does provide a trend line that now covers 43 years making it a valuable resource for understanding regional, state and local economies.
Two years ago, BEA stopped reporting employment data in response to the federal sequester of funds that applied to fiscal years 2013 and 2014. Among other things, this limited the value of REIS data in tracking recovery from the 2007 recession at the local (county) level. In May of 2014, the employment files were reintroduced to the system. As a result, we can now track employment as well as income through 2012, taking us through several years of what has nationally been a slow recovery in the employment sector.
In this issue of Cornhusker Economics, we will use REIS data to examine changes in employment between 2008 and 2012 for Nebraska counties. According to those data, the State of Nebraska added 6,376 total full-and part-time jobs over those five years. It is a weakness in REIS data that one cannot distinguish between full-time and part-time jobs.
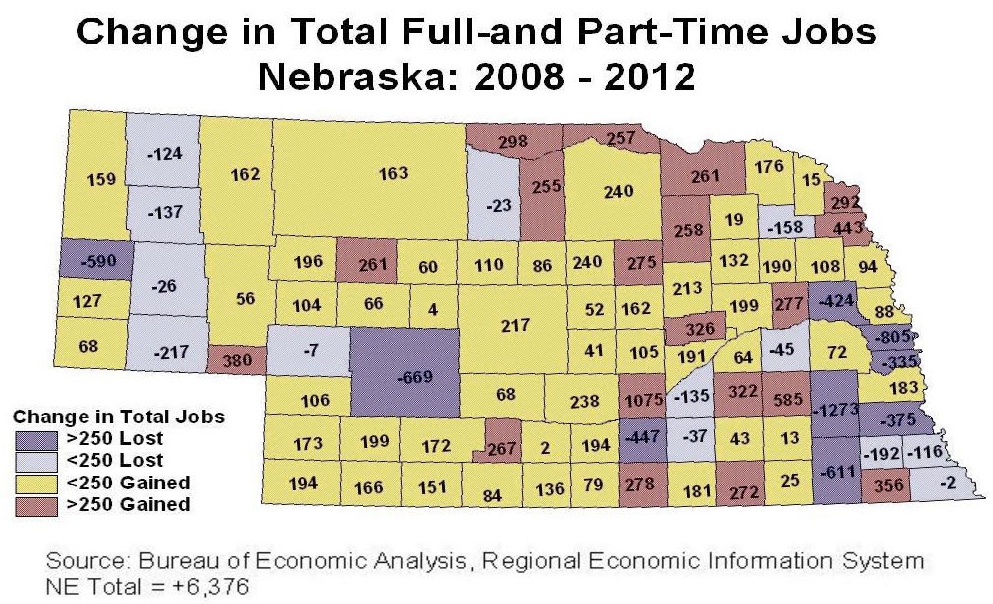 As depicted in Figure 1, 71 of Nebraska's 93 counties did indeed see increases in total full-and part-time employment between 2008 and 2012. Job losses where they did exist tended to be associated with Metropolitan and Micropolitan core counties and were, in some cases, quite sizeable.
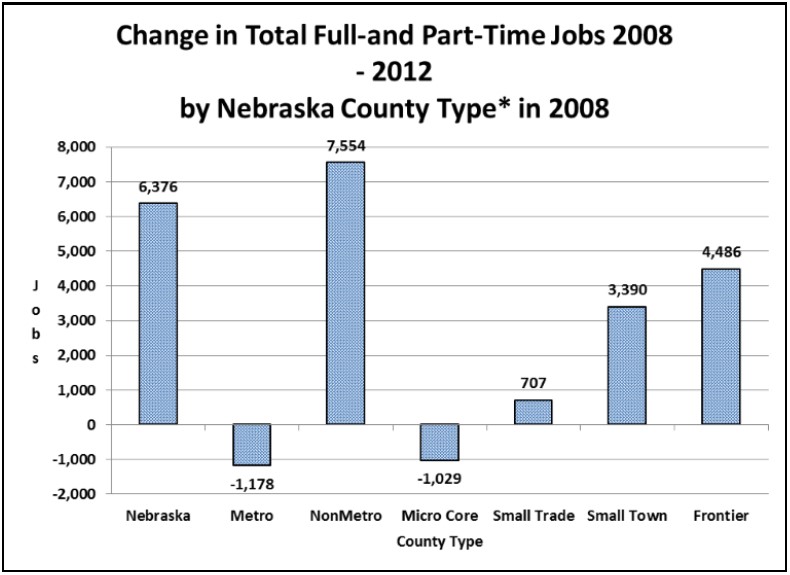
Figure 2 depicts a variation from historical trends. Nebraska's job growth between 2008 and 2012 appears to have been dominated by rural areas. According to these data, jobs in Metropolitan counties saw a net decline of 1,178 jobs between 2008 and 2012, while Non-Metropolitan counties saw total jobs increase by 7,754. Even in Non-Metropolitan Nebraska, it was the more rural counties that were responsible for the observed net increase in total jobs. The fastest rates of job growth were in fact Nebraska's most rural "Frontier" counties, which have no community of 2,500 or larger and a population density of less than 6 per square mile. Collectively, those 28 counties added 4,486 total jobs.
Change in total jobs does not provide a complete picture. Utilizing these data, all jobs are classified either as wage and salary jobs, nonfarm proprietor jobs or farm proprietor jobs. For the last several decades, the long-term trend has been for both farm proprietor and wage and salary jobs to decline in number, while earnings per job increased. At the same time, nonfarm proprietor jobs have increased in number, while earnings per job have declined.
Wage and salary jobs, which include tax withholding and employee benefits, have been seen as a more desirable employment type and are often what is meant when economic developers speak of job creation. Nonfarm proprietors are self-employed and this classification, in general, applies to anyone who files an IRS Schedule C. This covers everything from independent business owners and professionals to occasional contractors. Even when developers stress entrepreneurship, they are generally hoping that successful entrepreneurs will ultimately hire wage and salary workers.
According to the BEA, the period 2008 to 2012 was characterized by widespread losses of wage and salary jobs. This is seen in Figure 3 where Nebraska experienced a loss of 10,905 wage and salary jobs. Losses of wage and salary jobs were wide spread, 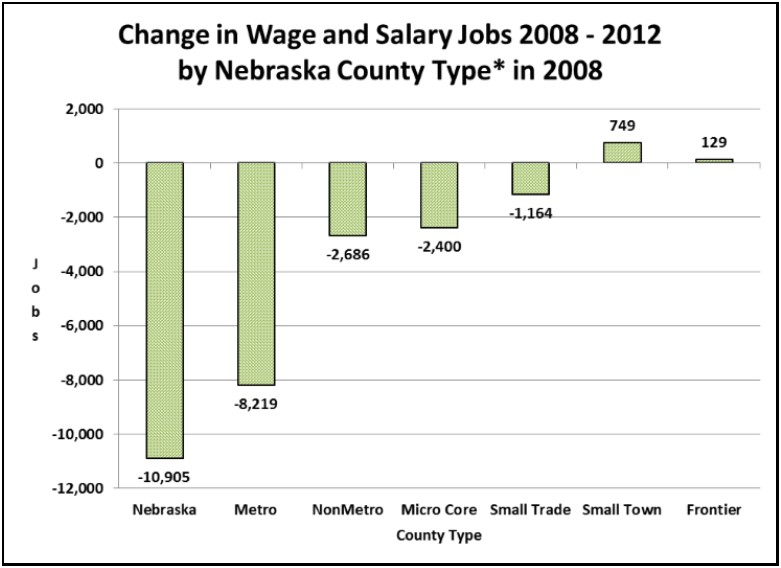 with only Nebraska's most rural counties experiencing an exception to that trend. "Small Town" counties (with no community as large as 2,500) and the previously described "Frontier" counties both recorded small increases in wage and salary employment during the period.
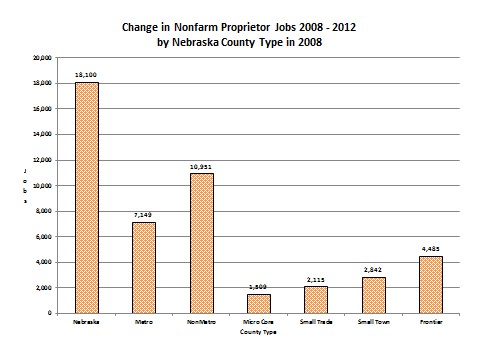 Nonfarm proprietor numbers, on the other hand, increased nearly everywhere in Nebraska between 2008 and 2012. In fact, only three counties saw a decline in the number of nonfarm proprietors (a total loss of 19 jobs). As seen in Figure 4, Nebraska added 18,100 nonfarm proprietor jobs over the period. Again, Non-Metropolitan counties led this growth, accounting for the addition of 10,951 nonfarm proprietor jobs with the greatest growth occurring in the most rural counties. By comparison, 7,149 nonfarm proprietor jobs were added to Nebraska's demographically much larger Metropolitan counties.
This variation from the long-term trend of Metropolitan counties leading Nebraska's total job growth may or may not indicate an actual shift in where Nebraska's jobs are being created. The data from 2008 to 2012 could well be simply an aberration caused by the latest recession with displaced wage and salary workers replacing those jobs with independent contracting and thus changing their employment classification.
What is clear, however, is that wage and salary jobs (which still total about 80-percent of all Nebraska jobs), are steadily being replaced; by self-employment. As seen in Figure 5, 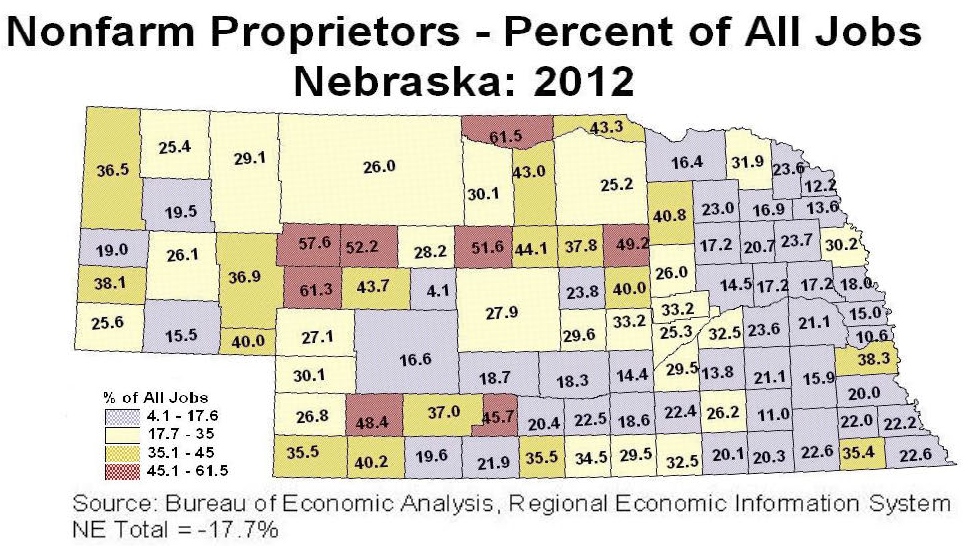 in 2012 there were five counties in which the majority of all jobs represented nonfarm self-employment. While the most recent recession may not have actually led to overall job losses in Nebraska, it may; have accelerated the trend toward greater self-employment, and this may be especially true in rural portions of the state.
Randy Cantrell, (402) 472-0919
Rural Futures Institute
University of Nebraska-Lincoln
rcantrell1@unl.edu