Cornhusker Economics Jan 31, 2024
Slight Cost of Production Changes Noted in the 2024 Nebraska Crop Enterprise Budgets
The 1Nebraska crop budgets are available for the 2024 production season. The 84 enterprise budgets prepared in the October 2023 timeframe use input prices collected as of that time. Overall, estimates reflect slight cost of production decreases in the budgets when compared to the 2023 cost estimates. For 2024, the main drivers of cost decreases are due to decreased fuel and fertilizer costs. In some cases, pesticide costs decreased, yet for some of those products, prices increased. Seed and interest costs have increased for 2024 adding to cash expenses, while land opportunity costs and depreciation costs have continued to rise which add to total economic costs in the crop enterprise budgets.
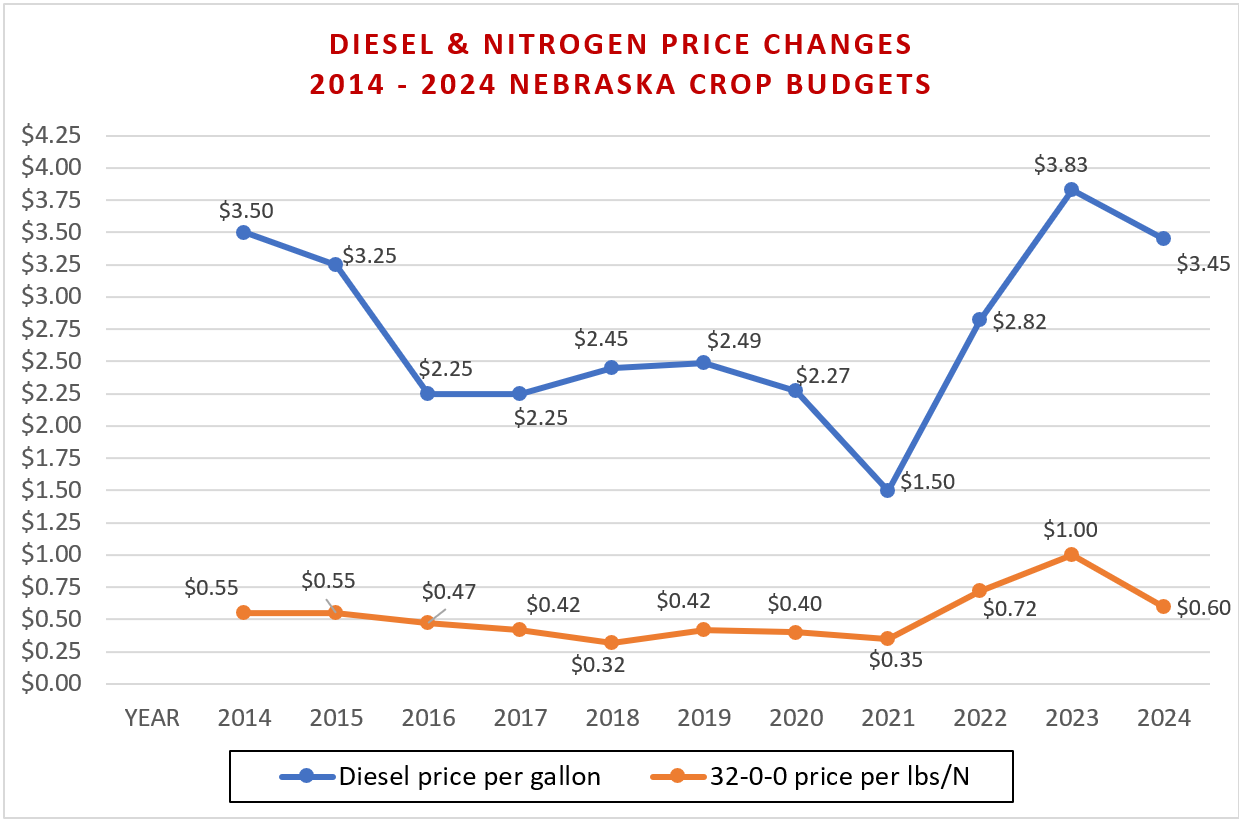
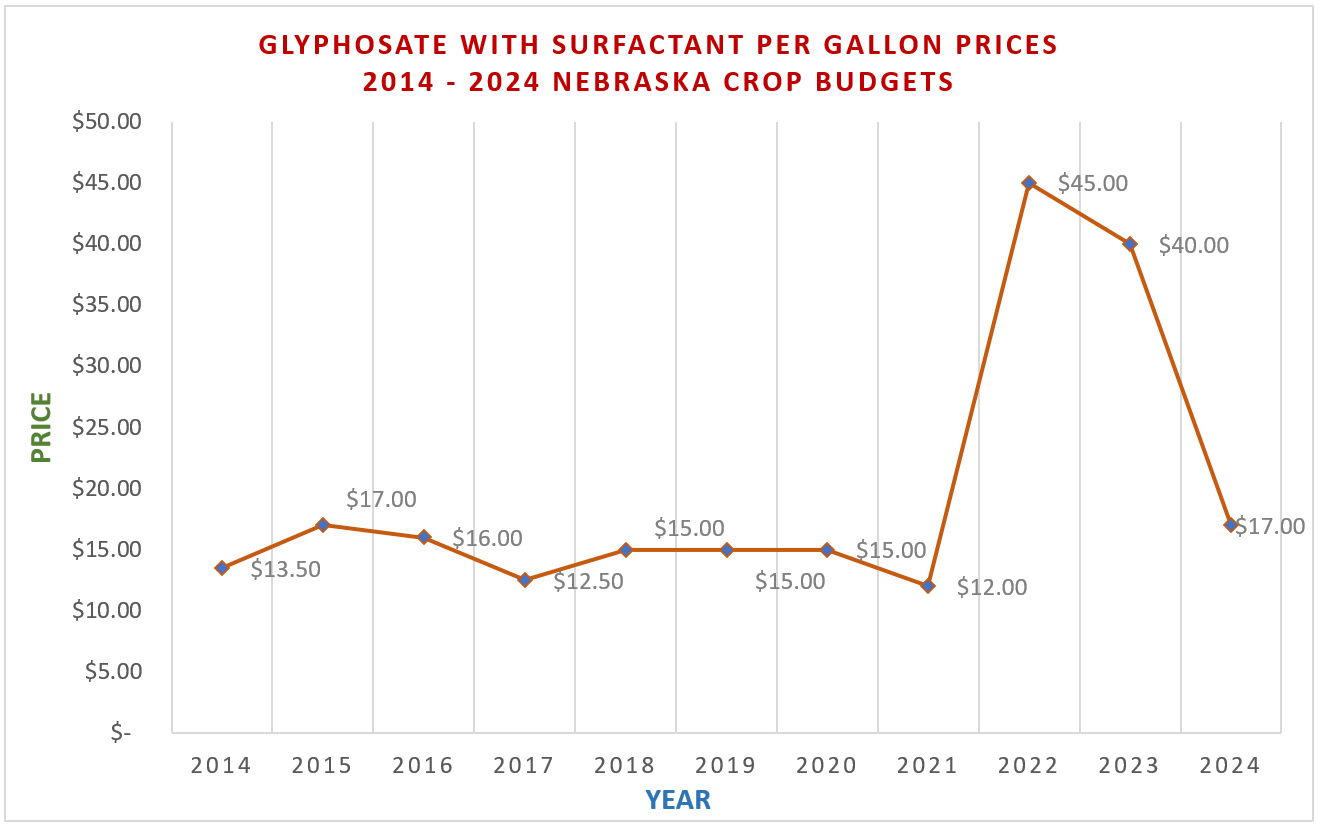
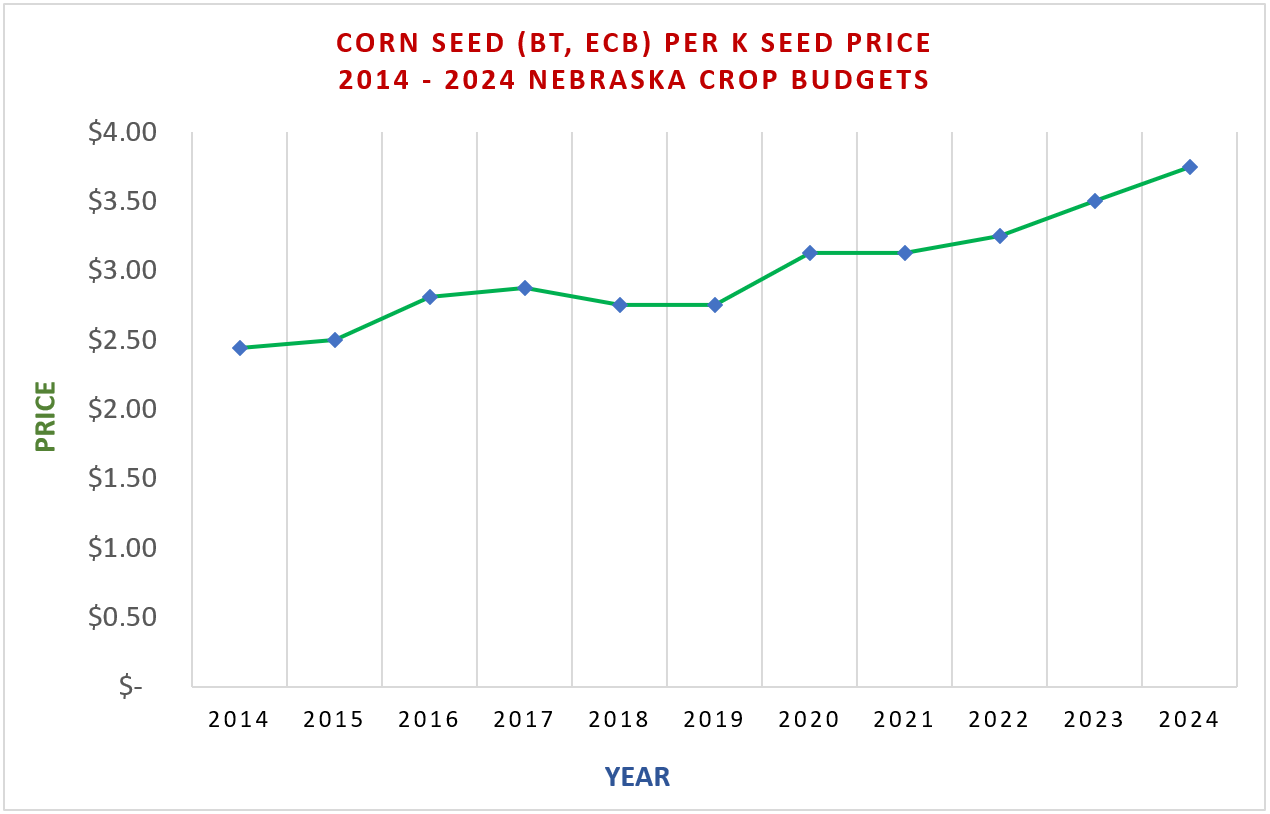
To illustrate a few material input cost changes over time, Graph 1 shows diesel prices per gallon used in the Nebraska crop budgets going back ten years to 2014. Graph 1 also shows price changes for 32-0-0 fertilizer per pound of nitrogen (lbs. N) over the same period. For 2024, both diesel and fertilizer costs were adjusted downward. Graph 2 also shows the herbicide, glyphosate with surfactant, price per gallon at $17 per gallon, down from the 2022 high of $45 per gallon. On the flip side, Graph 3, shows a type of corn seed rising in price per k seed unit (1,000 seeds) over time since 2014.
Graph 1
Graph 2
Graph 3
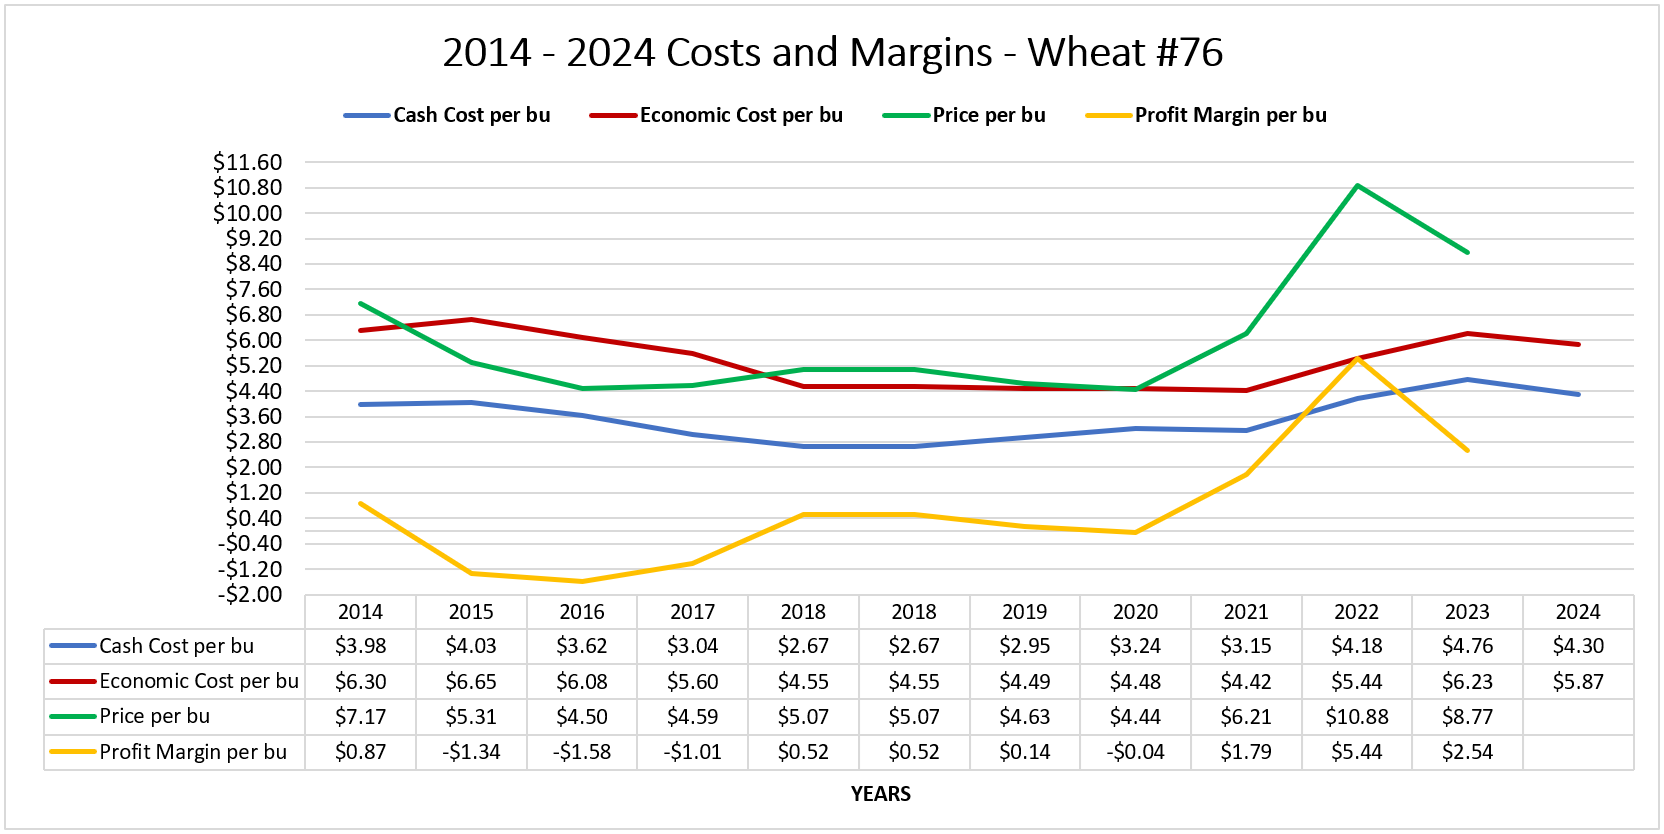
Using the same timeframe and a look back using examples of two Nebraska corn budgets (one dryland and one irrigated), a dryland soybean budget, and a dryland wheat budget from 2014 forward, Charts 1 - 4 and accompanying tables provide a summary of cash costs and economic (total) costs per bushel for each year. The prices used in these charts are the crop insurance harvest price guarantee for each year. An estimated profit margin per bushel figure is provided, using the price per bushel minus the total economic cost per bushel. Since the 2024 crop insurance harvest price guarantees were not yet available, those figures and estimated profit margins for 2024 are not shown.
Chart 1
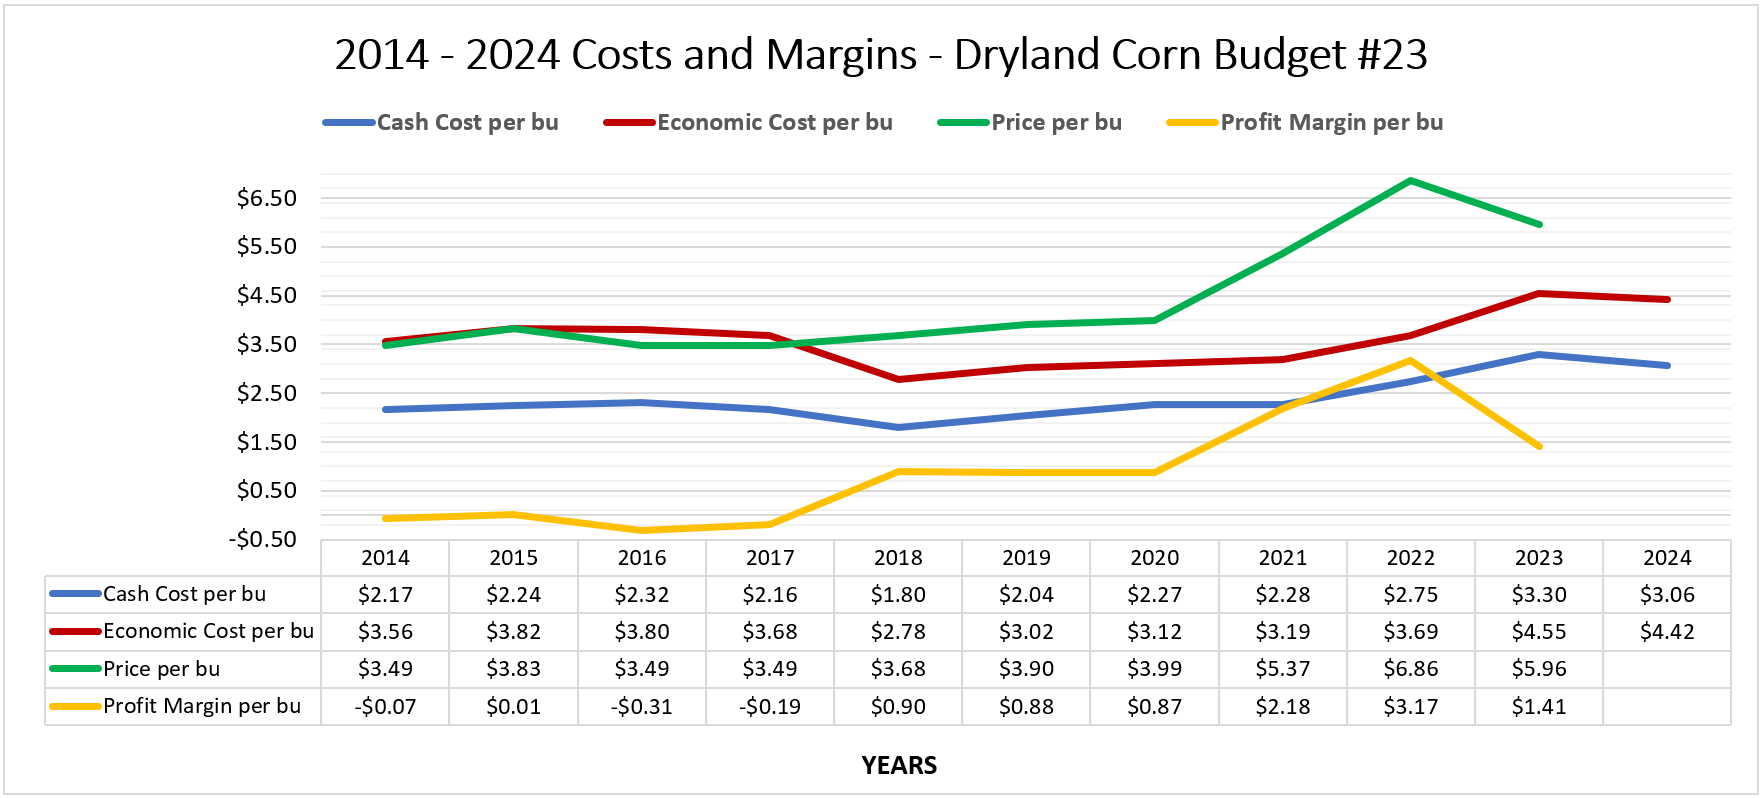

Chart 2
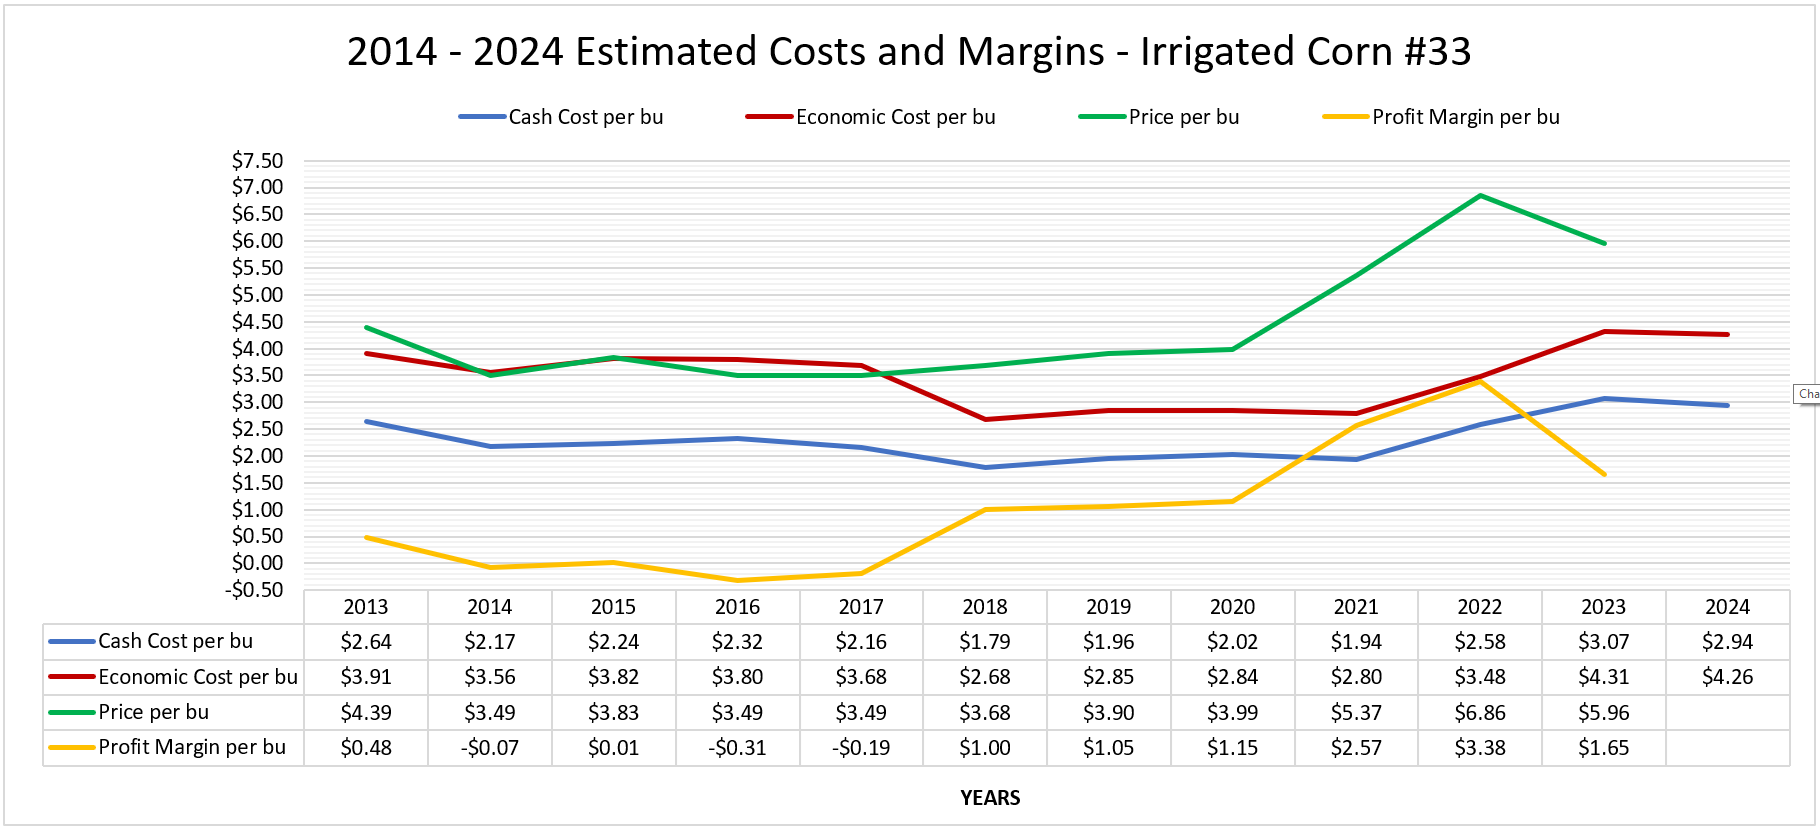

Chart 3
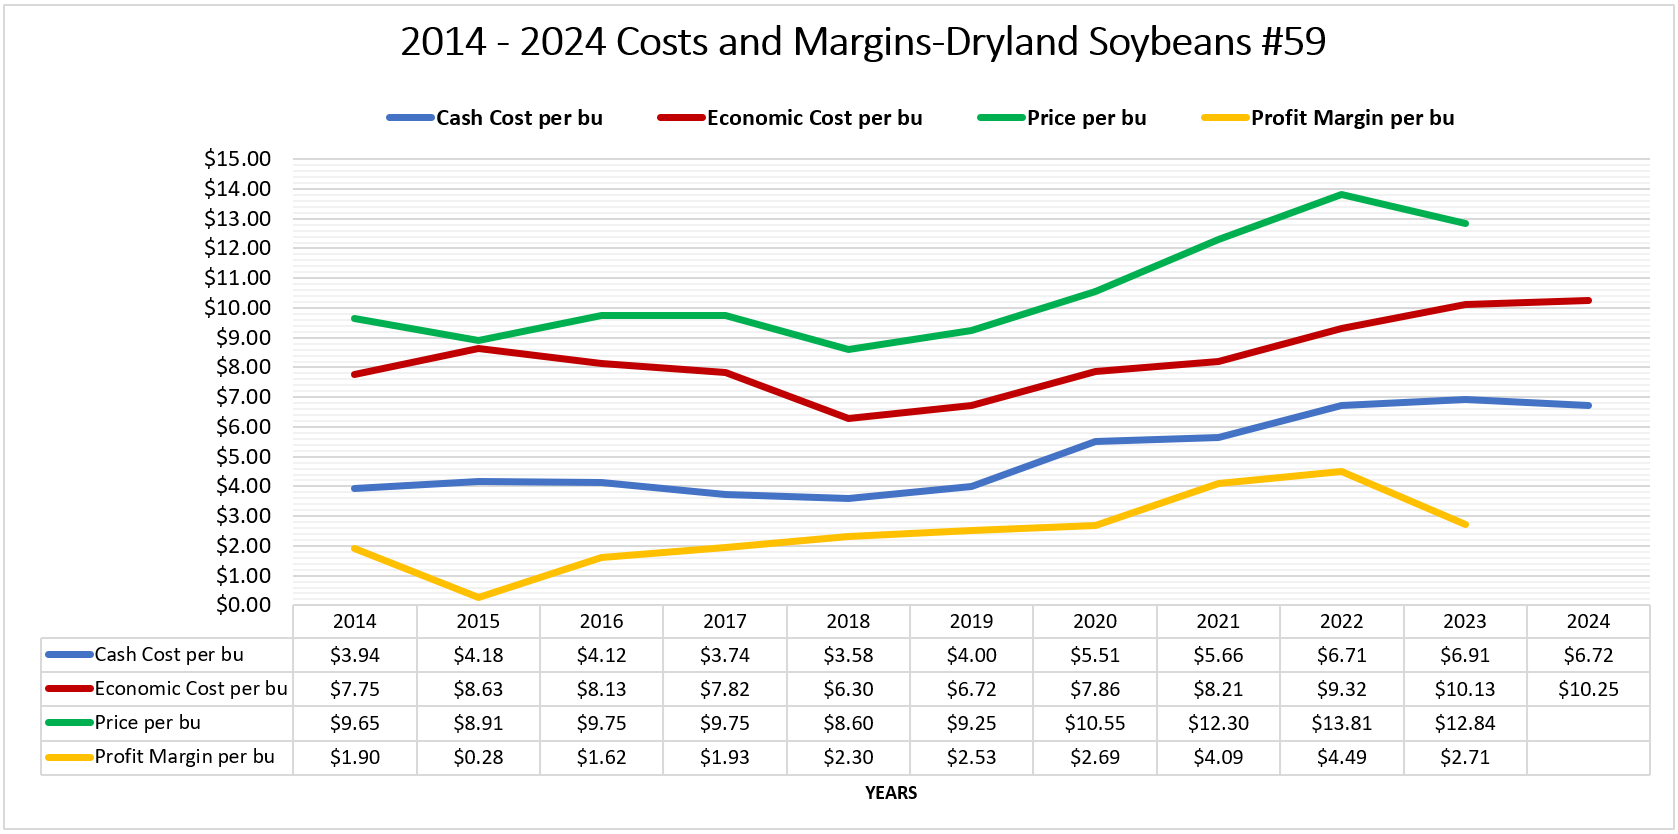

Chart 4

Enterprise budgets can provide producers with financial risk exposure information associated with yield or market changes. It is important to develop cost of production baseline information to utilize market opportunities as they are available, consider input decisions, and make timely risk management decisions. Knowing projected enterprise costs, related reports and analyses can provide confidence in decision making. 2
Additional Nebraska Crop Budget Details to Note
Nebraska Extension crop specialists and economists annually prepare the University of Nebraska crop budgets. Additional crops in the 2024 budget reports include: alfalfa, dry edible beans, grain sorghum, grass hay, millet, peas, oats, sugar beets, and sunflowers. The budget reports are provided in several formats, including cash and economic budget reports from the Agricultural Budget Calculator (ABC) program. Producers and agricultural managers can use ABC to create their own crop enterprise budgets or modify the 2024 Nebraska budgets that are downloadable in the program. Excel and printable PDF report versions are available as well.
The 2023 Nebraska budgets are figured based on a projected yield to calculate both a total economic and a cash cost per unit of production. Cash costs do not include the ownership cost of machinery and equipment used in field operations, nor a real estate opportunity cost when land is owned. Conversely, economic costs include an opportunity cost of land and equipment, plus depreciation costs of machinery and equipment.
Land values from the 32023 Nebraska Farm Real Estate Report are used in the budgets to calculate land ownership opportunity costs. If an operator rents crop ground, land value and real estate taxes can be eliminated in the budget and replaced by the amount paid for cash rent. In this scenario, cash costs will increase due to the added cash rent expenses.
In addition to depreciation and ownership costs of machinery and equipment, field operation costs include labor, fuel, and repair expenses. Repairs and depreciation expenses are figured using the American Society of Agricultural and Biological Engineers standard formulas and equations for power units and implements. The 2024 labor rate remained the same as last year’s figure of $25 per hour. Labor costs for each operation are calculated using machinery accomplishment rates and are adjusted for the additional time required for getting machinery ready, adjusting machinery, and handling material inputs.
The Nebraska crop budgets are created using assumptions thought to be valid for many producers across the state, however, each farming operation is unique. Cost scenarios for individual producers can vary based on their timing of input purchases and price variabilities, therefore, it is recommended that producers utilize the Nebraska budgets as a guide to prepare their own enterprise budgets, updating expense figures as needed, then adding their own equipment, irrigation expenses, interest expense estimates, and land costs that pertain to their crop ground.
Resources:
1 Klein, R., McClure, G., 2024 Nebraska Crop Budgets, University of Nebraska – Lincoln, cap.unl.edu/cropbudgets
2 Van Tassell, L., McClure, G., Parsons, J. “11 Key Management Decisions Made Easier Using the Agricultural Budget Calculator (ABC).” CAP Series 22-1002, Center for Agricultural Profitability, University of Nebraska-Lincoln, October 25, 2022.
3 Jansen, J., Stokes, J., Nebraska Farm Real Estate Report 2023 Final Results. University of Nebraska – Lincoln, cap.unl.edu/realestate
Glennis McClure
Extension Educator, Farm & Ranch Management Analyst
Department of Agricultural Economics
University of Nebraska – Lincoln
gmcclure3@unl.edu
402-472-0661