Cornhusker Economics Sep. 28, 2022
The Storm in World Fertilizer Markets Continues
Introduction
This article updates the recent article on world fertilizer markets by Beghin and Nogueira (2021), which noted the perfect storm affecting global fertilizer markets through high demand, droughts affecting fertilizer supply, high fossil energy prices, Covid 19-related supply-chain disruptions, and trade policies, all conspiring to elevate fertilizer nominal prices to levels not seen since 2008. In the last 10 months, the Ukraine-Russia war and associated trade sanctions have exacerbated the disruptions in fossil energy, grain, vegetable oil, and fertilizer markets already present in 2021. On the more hopeful side, some US trade policy developments will help reduce US fertilizer prices. Trade restrictions put in place by some countries are concerning.
The article reviews what is happening in fertilizer and natural gas prices, a key ingredient in the making of many fertilizer mixes. Then it looks at fertilizer affordability relative to crop prices. A discussion of recent trade policy developments abroad and in the US and their effects on energy, agricultural commodity and fertilizer prices completes the update.
Fertilizer prices
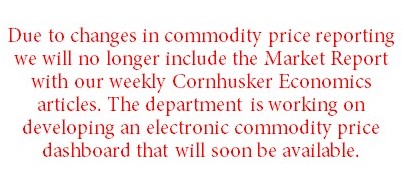
Fertilizer prices are shown in Figure 1. The series shown are international prices for diammonium phosphate (DAP), Phosphate rock, Potassium chloride (potash), triple superphosphate (TSP), and nitrogen-based Urea. These are from the World Bank’s “Pink Sheet” the main source of international prices. Note the co-movements of DAP, Urea, and TSP prices. The price of DAP, TSP, and Urea peaked around April-May 2022 but have remained elevated. These prices tend to follow the evolution of natural gas prices since DAP and urea contain nitrogen produced with natural gas. TSP does not contain nitrogen, but in its production process, it requires steam and then drying steps, which are fossil-fuel intensive, hence the correlation with the other two fertilizers.
Phosphate rock and potassium chloride prices are lower than the prices of DAP, TSP, and Urea but they have not definitely peaked yet. Also note that phosphate rock is the key ingredient in TSP, which suggests another reason why TSP prices have been elevated. Next, we look at natural gas prices to provide some prognosis on what will happen to Urea, DAP, and TSP prices.
Natural gas prices and supplies
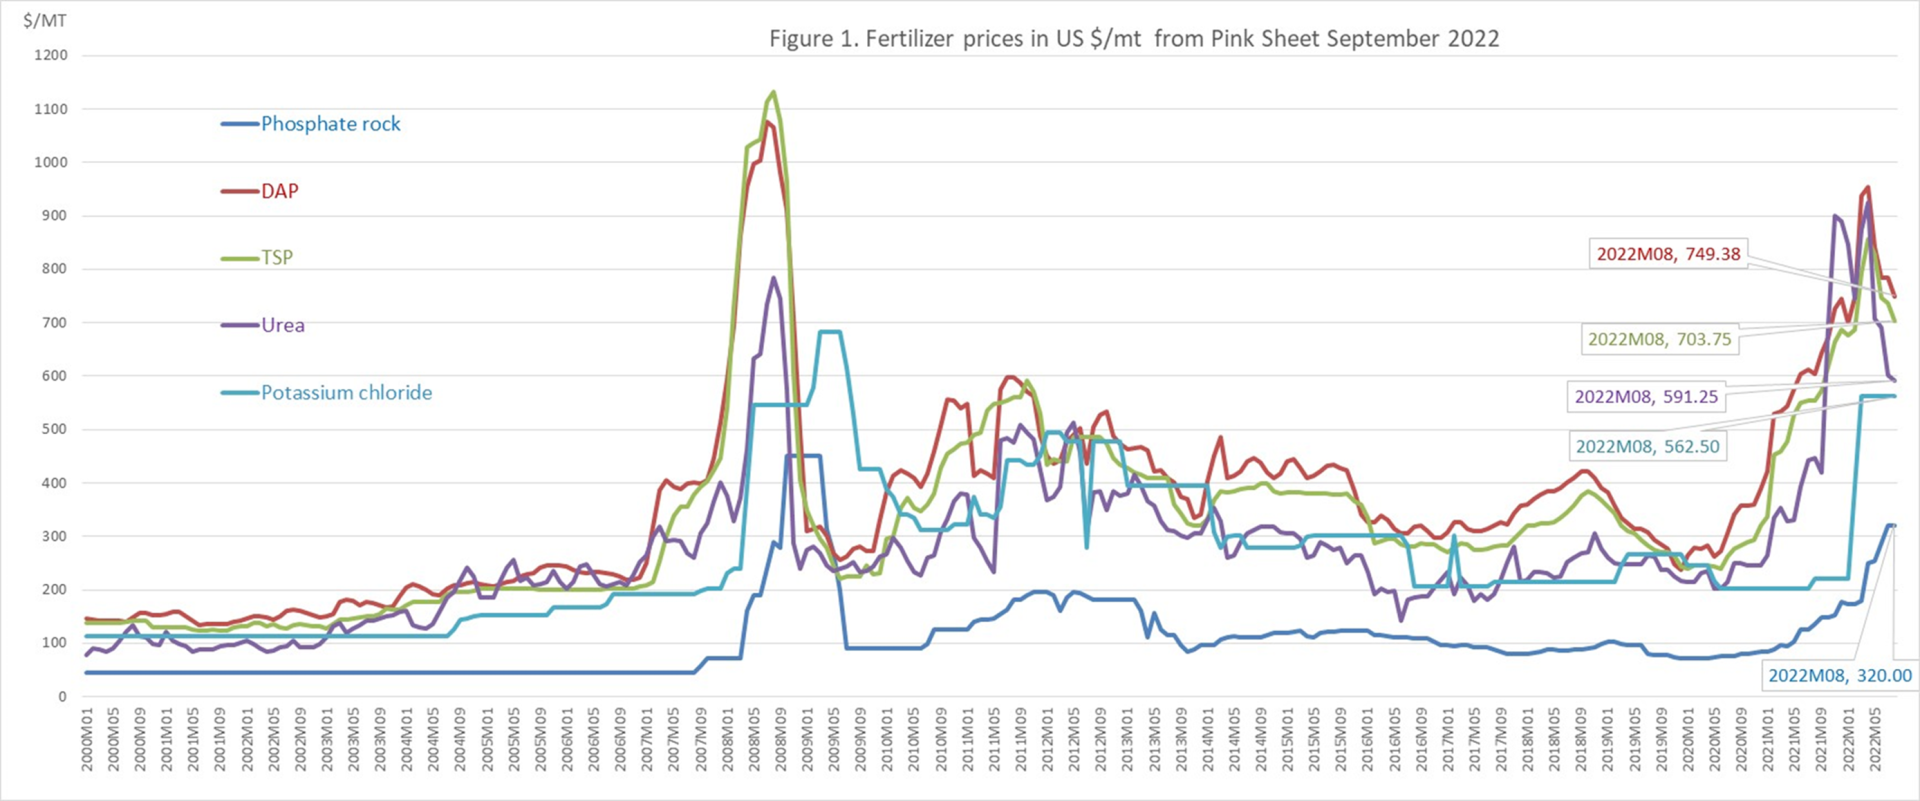
Natural gas prices are shown in Figure 2 for US, EU, and Japanese markets. Natural gas prices have increased dramatically worldwide but in a differentiated fashion. Europe’s dependence on Russia for about a third of its supply of natural gas. The EU has been deeply affected, with prices reaching the unprecedented stratospheric level of 70$/MBTU. Current EU policies are attempting to reduce the impact of these price increases, by capping electricity prices, but the sustainability of such policies is questionable.
Price arbitrage in the natural gas market takes a long time because it requires dedicated infrastructure and takes time with maritime transportation. The US is a large producer and exporter of natural gas. The US has been exporting as much as it can and export demand has resulted in high prices in the US markets, at roughly 3 times their historical levels (long-term average of 2.3$/MBTU and around 8$/MBTU in recent months). Nominal US natural gas prices were even higher in 2005 and 2008. These peaks in US natural gas prices induce high nitrogen fertilizer prices given the intensity of natural gas in nitrogen fertilizers and associated mixes. Natural gas prices in the EU and in Asia (as proxied by the Japan LNG import price) have been so high that agrochemical companies in many countries have stopped producing fertilizer because margins have been annihilated by natural gas prices. This curtailment of supply exacerbates price effects.
Affordability ratio
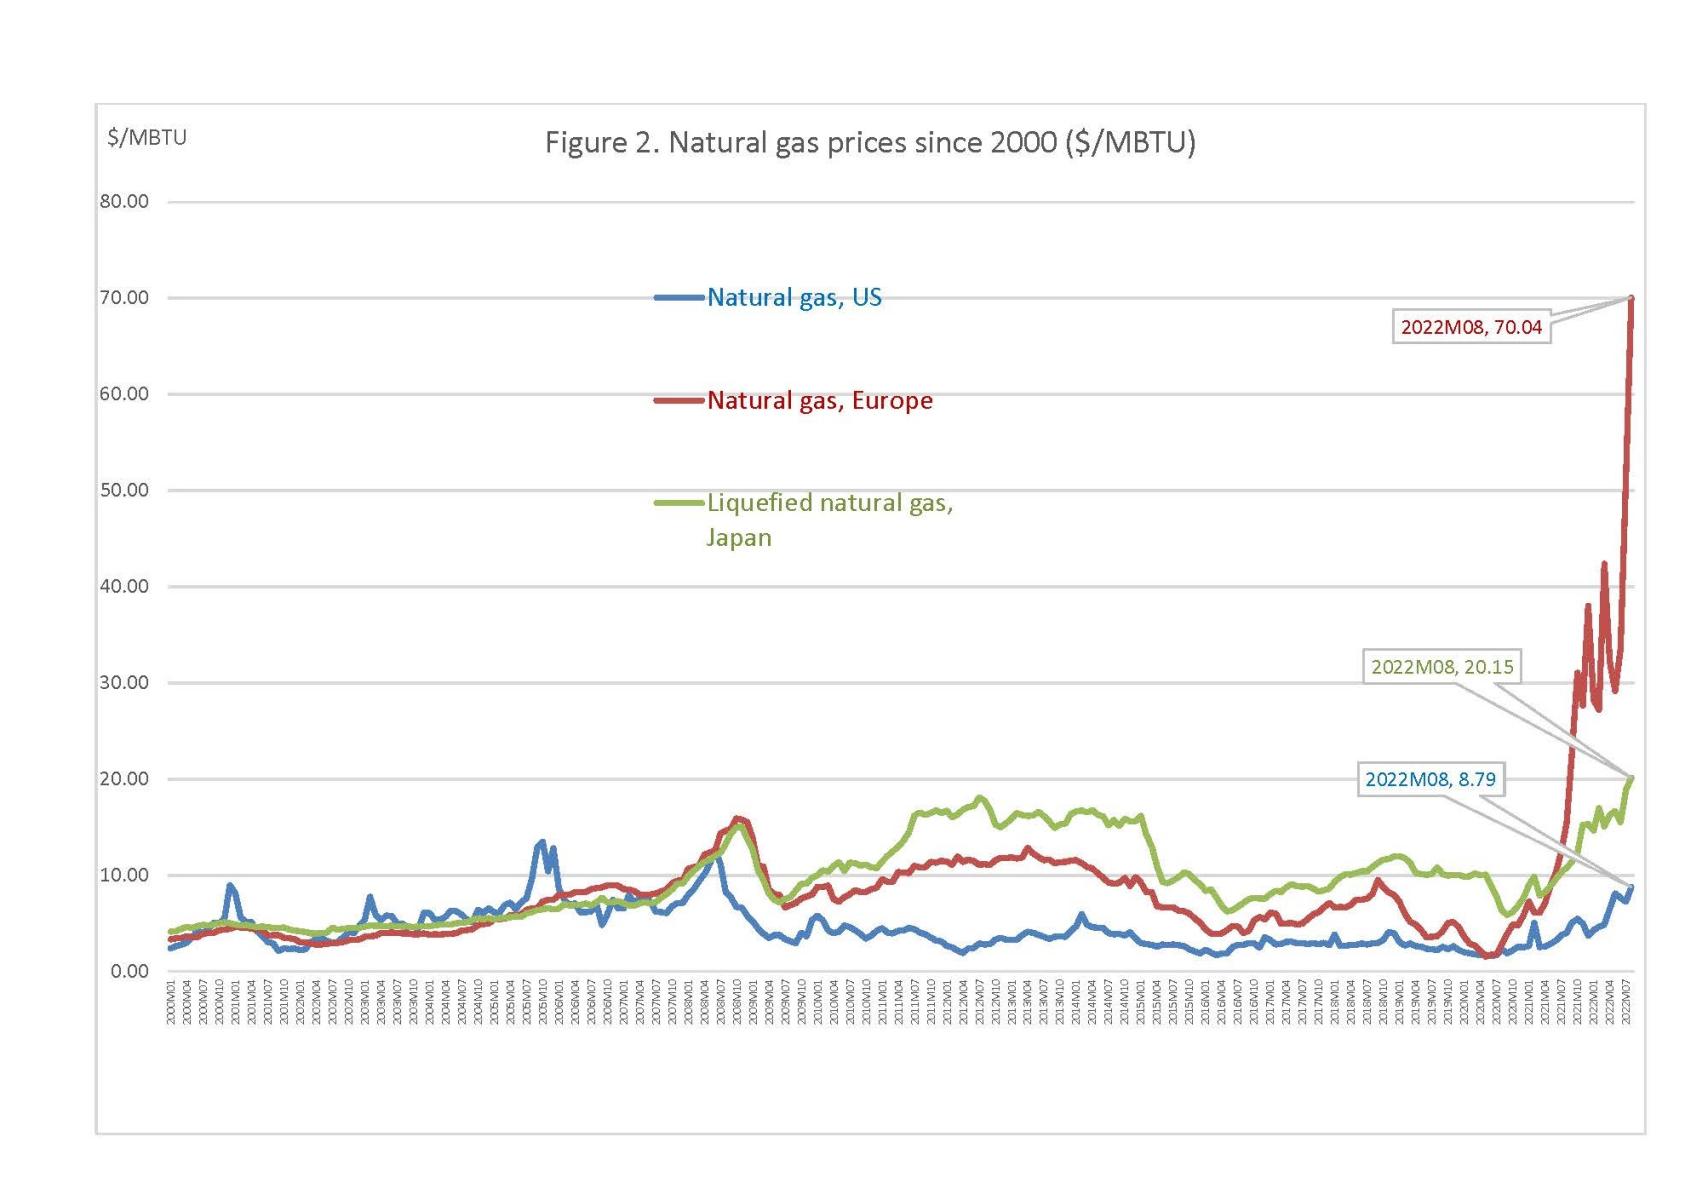
As crop prices have also remained elevated, one legitimate question is to know what has happened to fertilizer affordability, which had deteriorated in 2021. The fertilizer affordability index is a simplified measure of farm return over the cost of fertilizer. Figure 3 shows the cost of fertilizer relative to crop prices (fertilizer price index/grain price index), based on monthly data from the Commodity “Pink Sheet” of the World Bank (World Bank, 2022), as well as the two price indices. See the left vertical axis for price indices, and the right vertical axis for the affordability index. A higher value of the affordability index indicates a deterioration of the affordability. As shown in Figure 3, the index peaked at the end of 2021, but remains considerably elevated, well above trend by nearly 50%. Note the trend line and its positive slope, which indicate that there is a secular decline in affordability that took place during the last 6 decades. The cost of fertilizer relative to grain prices has been increasing since the 1960s from around .6 in 1960, to well near unity in the last decade and above 1.5 in recent months. Note also the previous episode on low affordability in 2008 when fertilizer prices increased more than commodity prices. It was actually more acute than what we are experiencing now.
Volatility in crop and fertilizer prices has been increasing in the last 5 years creating more planning and marketing challenges for farmers. The coefficient of variation (CV=standard deviation/mean) indicates the dispersion of prices relative to their means. The CV of fertilizer prices was 0.48 in the last 5 years based on monthly data from the Pink Sheet, whereas grain prices’ CV was 0.22. The CV of the affordability index is 0.25 for the last five years. Hence the high volatility of fertilizer prices has been somewhat tempered by crop prices. All these CV values are much higher than they had been in the last decade, by roughly one order of magnitude.
The Ukraine-Russia war
The war between Russia and Ukraine and associated sanctions against Russia and Belarus have induced Russian fertilizer export supply interruptions and much higher prices with no end in sight for the European market. Russia is a large exporter of all three (N, P, K) fertilizers, and so is Belarus for potassium fertilizer.
The combination of trade sanctions against Russia and Belarus and disruptions in physical infrastructure (--Urea fertilizer flows through Ukraine) have also exacerbated the scarcity of most fertilizers. Even though the US depends on Canada’s source of potassium fertilizer, the impact of scarce supplies is worldwide and affects the price of Canadian potassium fertilizer.
Trade Export Restrictions
The database of fertilizer trade restrictions maintained by IFPRI indicates that China has stopped urea and phosphate exports in order to ensure adequate supplies at reasonable prices for domestic food production. Initially, the restrictions were set to expire in June 2022. These export restrictions have been extended for the rest of 2022. The issue in China is power generation limitation from the serious drought experienced this summer and high coal prices. The drought also raises concerns about potential logistics and freight issues as waterways are more difficult to navigate.
Ukraine (for nitrogenous fertilizers) and China (for phosphate rock) have export bans until the end of December 2022. Russia (for nitrogenous fertilizers) and China (for all fertilizers) have export licensing requirements with some export quotas and inspections. Vietnam put a 5% export tax on fertilizer exports for 2022. Many of these policies were set before the Ukraine-Russia war as a policy response to mitigate internal prices. However, these policies further aggravate world price effects as global export supply decreases with the bans. There is also a tendency for export restrictions to snowball as world prices keep increasing. In aggregate, export restrictions have some self-defeating features. The future will tell if other exporting countries also put export restrictions in place. The peak in DAP, TSP, and Urea prices has passed, so one can be hopeful that contagion in export restriction will not take place.
Trade policy in the US
In July 2022, the USITC made the determination that after all, imports of fertilizer from Trinidad and Tobago and Russia did not induce injury to the US fertilizer industry, which means that countervailing duties will not be imposed on nitrogen fertilizers from these countries. Imports from Russia have been disrupted by the war and associated sanctions, so the impact of a tariff would have been muted for the latter.
A second development in US trade policy took place in July 2022. It is still prospective. The Court of International Trade is considering appealing the USITC determination that Moroccan and Russian phosphorous imports have injured the US fertilizer industry. The original petition to the USITC was initiated by Mosaic, a large US-based global producer of fertilizers. The determination of the USITC was controversial given the lack of strong evidence of dumping margins by these two countries. The current countervailing duty on phosphorous fertilizer from Morocco is nearly 20 percent on all sources within Morocco. For Russian imports, the rates vary by sub-source (Industrial Group Phosphorite LLC, 47.05%; Joint Stock Company Apatit, 9.19%; and All Other Producers/Exporters, 17.20%). Reshuffling global trade in fertilizers takes time. It further complicates complex logistics and increases transportation costs, even if world supply had not been reduced (it has as noted above). Logistics have not fully recovered from disruptions caused by the pandemic and subsequently by the strong recovery of global trade, postCovid19.
In summary, the outlook on fertilizer prices remains pessimistic with a series of factors contributing to elevated prices, although affordability may slightly improve as long as commodity prices decrease more slowly than fertilizer prices do. The silver lining is that common factors such as the war in Ukraine and high fossil fuel prices influence both agricultural commodity and fertilizer prices.
References
Beghin, John C., and Lia Nogueira. A perfect storm in fertilizer markets. Briefing paper No. 1723-2021-3109. 2021. https://ageconsearch.umn.edu/record/316020/
USITC. Urea Ammonium Nitrate Solutions from Russia and Trinidad and Tobago. Investigation Nos. 701-TA-668-669 and 731-TA-1565-1566 (Final). Publication 5338, August 2022.
The World Bank. World Bank Commodities Price Data (The Pink Sheet), September 2022. Prospects Group, The World Bank. https://www.worldbank.org/en/research/commodity-markets
John C Beghin
Mike Yanney Chair and Professor
Department of Agricultural Economics
University of Nebraska Lincoln
beghin@unl.edu
402-472-2749