Cornhusker Economics February 15, 2015The Economics of ARC vs. PLC
Nebraska crop producers are currently analyzing farm program alternatives and making decisions at local USDA Farm Service Agency (FSA) offices. Nebraska Extension has partnered with FSA to provide educational meetings to producers to cover program details, decisions, and analysis tools. Extension educators and specialists working on farm bill education delivered an initial round of more than 70 educational meetings in conjunction with FSA in late 2014 and reached nearly 11,000 producers, landowners, and agricultural professionals across the state, with more educational meetings and analysis workshops continuing at present.
The focus of these educational meetings and analysis is a portfolio of new farm programs and policies and the set of three farm program decisions facing producers and landowners under the 2014 Farm Bill. Landowners face a decision on whether to update their program payment yields and a decision on whether to update (reallocate) their program base acreage by February 27 while producers face a decision about electing the ARC (Agriculture Risk Coverage) or PLC (Price Loss Coverage) program by March 31.
The decisions range from simple to complex and involve not just an understanding of farm program mechanics, but also crop insurance options, individual farm data and history, and a perspective on the outlook for commodity market prices through the 2018 crop year.
Yield Update
The yield update is the most straight-forward of the decisions facing producers. Landowners can choose to keep their current counter-cyclical payment yields or update their payment yields based on their actual average yields per planted acre from 2008-2012. They can certify their yields for update purposes using available crop insurance information on proven yields, subject to potential audit. If they have years of low yields or lack the yield evidence, they can also accept a substitute yield equal to 75% of the county average from 2008-2012 for those years in their history.Producers are able to choose whether to keep their current payment yield or update their payment yield on a crop-by-crop, farm-by-farm basis. The payment yield only affects the PLC program through 2018, but the obvious choice for producers is to update yields when possible, given that these payment yields are likely to stay with the farm long after the current farm programs expire in 2018.
Base Update
The base update is more complex and can involve a tradeoff between expected payments and risk protection. The basic choice for landowners, on a farm-by-farm basis, is to keep their current program base acreage or update it by reallocating the existing base acreage according to the average mix of planted and prevented-planted acres of program commodities on the farm from 2009-2012. The base acreage update is an all-or-nothing choice on a farm-by-farm basis. Landowners cannot choose which bases to keep and which to update on a given farm, but must choose to keep the current base intact or completely update to the new reallocated base acreage, creating potential tradeoffs in the decision.
Some farms will find obvious advantages in updating base acres to increase expected program payments or better reflect their current crop mix and provide more effective risk protection for what they currently grow. However, other farms will find their existing base acreage generates higher expected program payments than a new, reallocated base would and may choose to forego the base acreage update. The expected payments and risk protection from this base acreage decision are inherently tied to the ARC vs. PLC decision, making the base acreage decision more complex and likely dependent on the ARC vs. PLC analysis.
ARC vs. PLC
While landowners (or producers with power of attorney for the landowners) officially make the base and yield decisions, the producer (having a share of the risk in the growing crop) officially makes the ARC vs. PLC election that is binding on the farm for the 2014-2018 crop years. The basic election decision appears to be a straight-forward choice between 1) Agricultural Risk Coverage at the individual coverage level (ARC-IC), a single, whole-farm revenue safety net for all crops on all farms the producer enrolls in ARC-IC; 2) Agricultural Risk Coverage at the county level (ARC-CO), a crop-by-crop revenue safety net; or 3) Price Loss Coverage (PLC), a crop-by-crop price safety net, with the choice between (2) and (3) on a farm-by-farm, crop-by-crop basis.
ARC provides revenue protection based on 86 percent of a moving average revenue benchmark at the farm or county level. For ARC at the county level (ARC-CO), the benchmark is equal to the 5-year Olympic average national marketing year average price multiplied by 5-year Olympic average county average yield per planted acre. There are minimum yields based on 70% of county transitional yields for crop insurance and minimum prices equal to the legislated reference price for each commodity to factor into the 5-year histories if necessary before calculating the Olympic averages and the resulting benchmark. ARC at the individual farm coverage level (ARC-IC) calculates a similar benchmark, but multiplies the farm yield per planted acre by the national marketing year average price for each year in the history before calculating the Olympic average of the resulting 5 years of revenue for each crop and then weighting that revenue across all crops based on current planted acreage to determine the effective ARC-IC benchmark and guarantee for each year. The same minimum yields and prices used for ARC-CO factor into the calculation of the revenue histories for ARC-IC.
For ARC-CO, payments are made if revenue for the current year at the county level for a specific crop is below the guarantee for that crop, with a maximum payment equal to 10% of the benchmark, effectively covering revenue shortfalls from 86% to 76% of the relative benchmark for each crop separately. ARC-CO payments would equal the shortfall per acre at the county level multiplied by 85% of the farm's base acres for that crop. For ARC-IC, payments are made if crop revenue for all program crops on the farm per planted acre falls below the guarantee, effectively covering revenue shortfalls when total revenue across all program crops falls between 86% and 76% of the farm's benchmark. The ARC-IC payment for the farm would equal the shortfall per planted acre multiplied by 65% of the farm's total base acres.
With the moving average, ARC provides substantial protection against the recent drop in market prices. As an example, the 5-year Olympic average price for corn the 2014 guarantee was $5.29, effectively providing revenue protection at $4.55 ($5.29 x 86%) given average yields. But, continued lower prices would also factor into the moving average, and if corn prices stay below the minimum price in the benchmark of $3.70, the revenue guarantee would fall over time to as low as $3.18 ($3.70 x 86%) at average yields.
PLC provides price protection if national marketing year average prices fall below legislated reference prices. PLC payments for a farm are calculated as the difference between the reference price and the national marketing year average price multiplied by the payment yield and paid on 85% (corrected) of base acres for each crop in the farm's base. For example, the PLC reference price for corn is $3.70 while current marketing year price projections from USDA are near $3.65. If prices were to fall from current levels, PLC payments could get larger and larger over time, making the decision between ARC and PLC more difficult given that it is a one-time election for the 2014-2018 crop years.
Projected Payments
Choosing between ARC and PLC involves analyzing the economics of each alternative in terms of expected payments, risk protection, and related crop insurance and other risk management decisions. Expected payments provide an initial comparison of program differences between ARC and PLC for given price and yield expectations through 2018.
Figure 1 shows the protection from PLC given a price expectation for corn of $3.65 per bushel for the 2014 crop year (based on January estimates from USDA) and prices trending toward $3.92 by 2018 (based on January estimates from the Food and Agricultural Policy Research Institute (FAPRI) at the University of Missouri). Following that price path exactly, the PLC program would provide payments for corn prices below the $3.70 reference price for 2014, but would disappear as prices climb above $3.70.
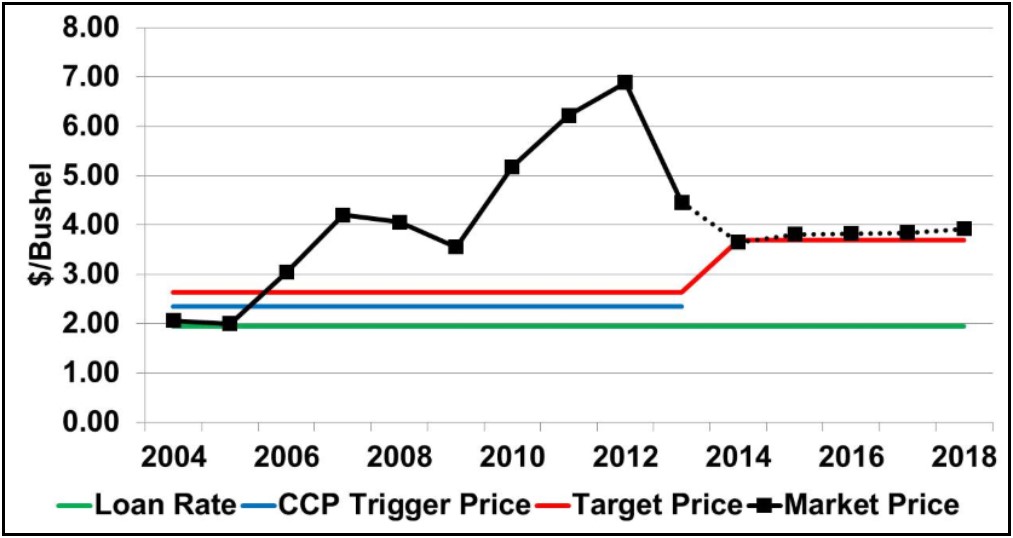
* Estimated national marketing year average price for 2013 and 2014 projected from USDA World Agricultural Outlook Board (USDA-WAOB) as of January 12, 2015. Projected prices for 2015-2018 from FAPRI estimates as of January 2015
Figure 2 shows the protection from ARC given the same price expectation for corn of $3.65 per bushel and the current estimated yield for the 2014 crop year as well as the same FAPRI-projected prices and trend yield projections through 2018. The graph uses state-level yield information for illustration (even though ARC payments are dependent on county or farm-level yields) to show how ARC works compared to the Average Crop Revenue Election (ACRE) program under the previous farm program. ARC would provide substantial support in I2014-2016 given current yield and price projections, but the ARC guarantees would fall over time as lower prices are factored into the moving average and resulting payments would disappear, even though revenue projections only improve modestly.
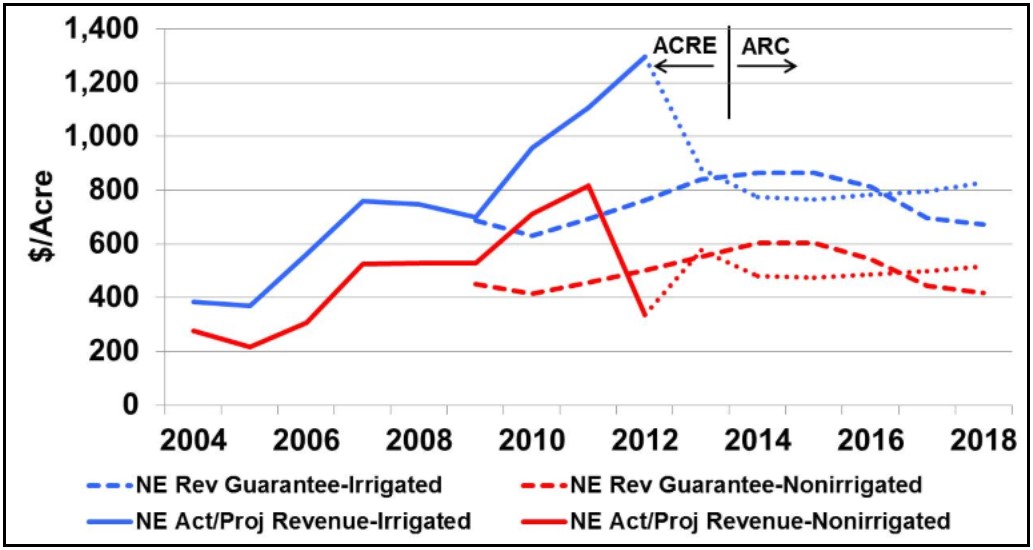
* Estimated revenue for 2013 from USDA-WAOB prices and USDA National Agricultural Statistics Service (USDA-NASS) yields as of January 12, 2015. Projected revenue for 2014 based on estimated yields and USDA-WAOB prices as of January 12, 2015. Projected revenue for 2015-2018 based on trend yields and FAPRI price estimates as of December 2014. Projected ARC guarantee for 2014-2018 shown at state level for illustration purposes only.
The PLC vs. ARC comparison on the corn graphs illustrates the differences and the tradeoffs between the two program alternatives. For soybeans, the revenue protection of ARC would follow a similar path, but the PLC protection would be non-existent because FAPRI price projections for soybeans do not fall as far as the $8.40 per bushel reference price. For grain sorghum and wheat, PLC is more significant although ARC continues to provide current protection as well.
Figures 3 through 8 extend the analysis to show projected payments per base acre under ARC and PLC for 2014 through 2018. The graphs are only an indicator of the potential magnitude of payments, using national prices and state-level yields for illustration (even though PLC payments are dependent on farm-level payment yields and ARC payments are dependent on county or farm-level yields).
The graphs generally show the large ARC payments that could come to producers in the early years of the farm program, but also the declining protection and declining payments from ARC in the later years given current price and yield projections through 2018. PLC payments are projected for corn only for 2014 given current price expectations with none projected for soybeans. But, for grain sorghum and wheat, the PLC payment projections are more substantial and are comparable to the projected ARC payments over the 2014-2018 period.
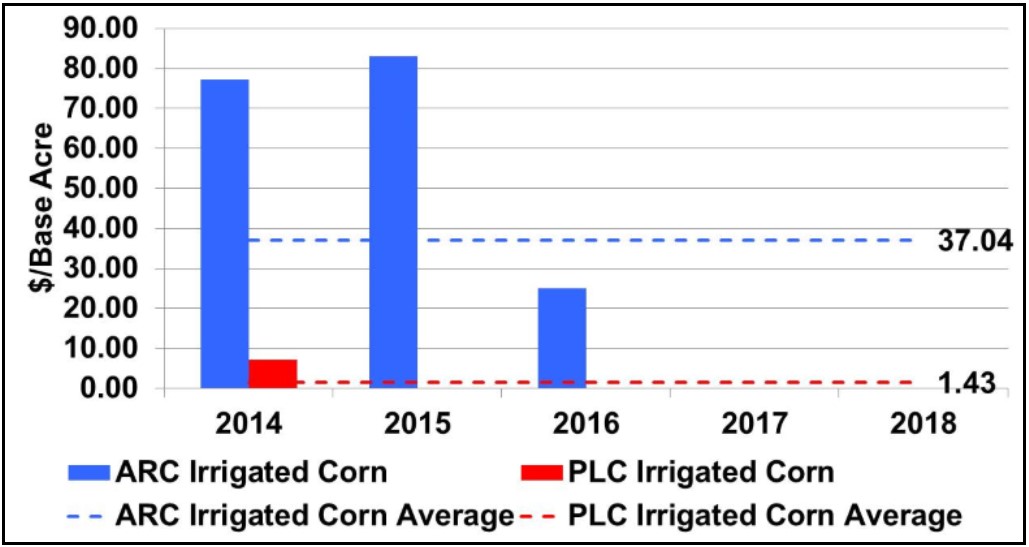
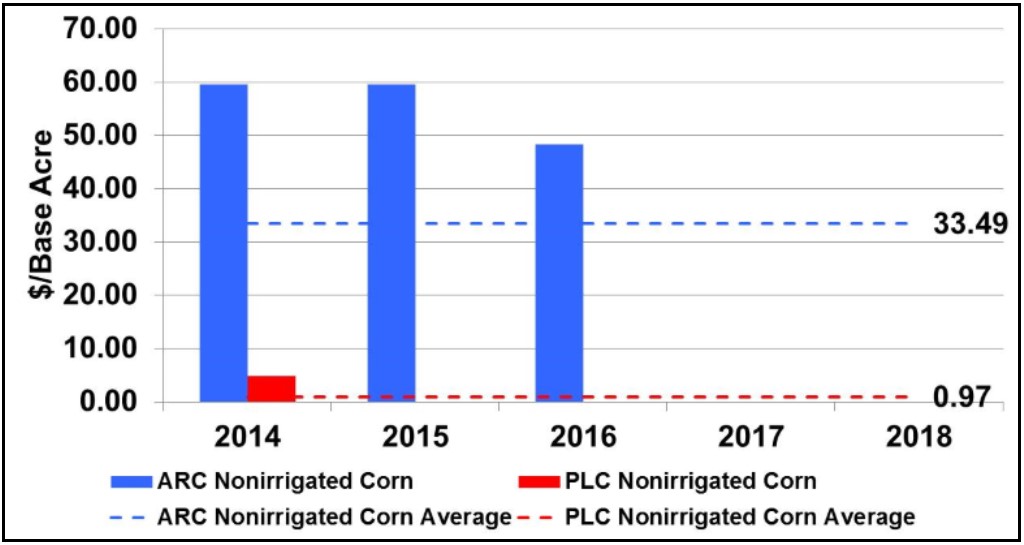
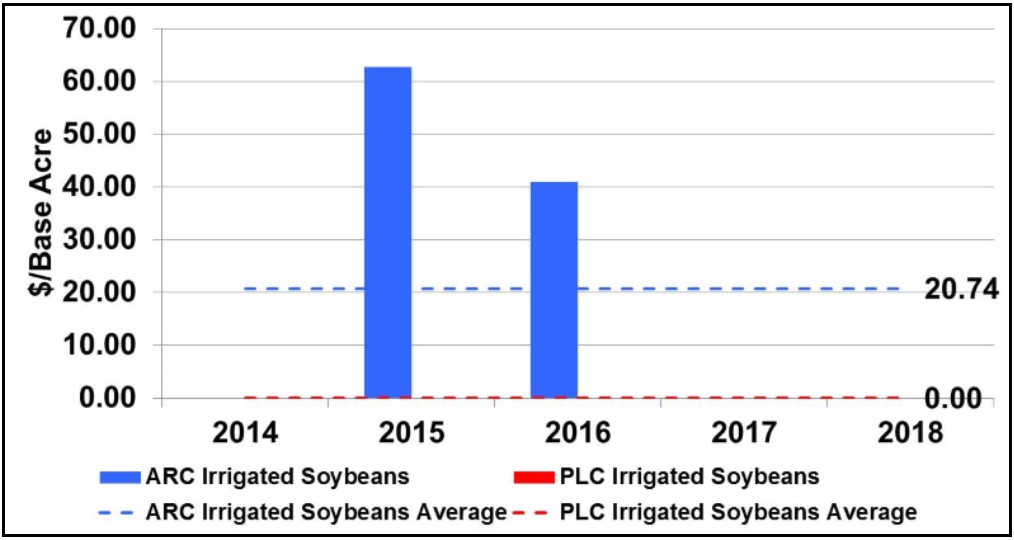
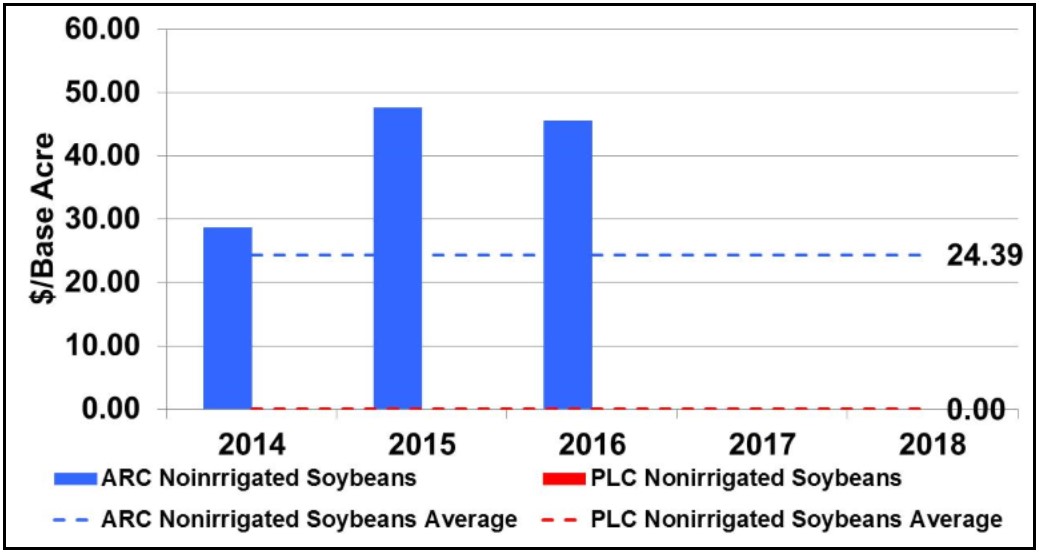
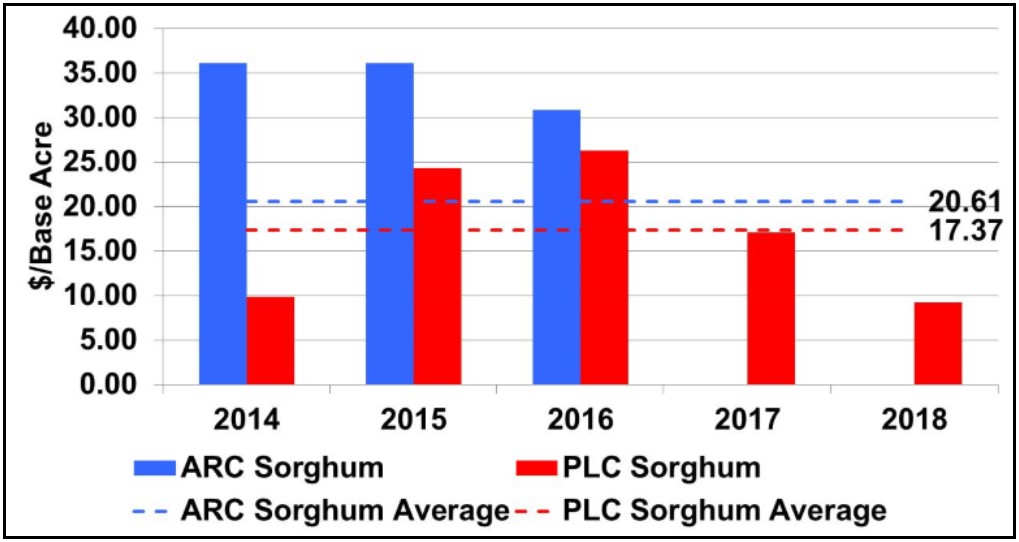
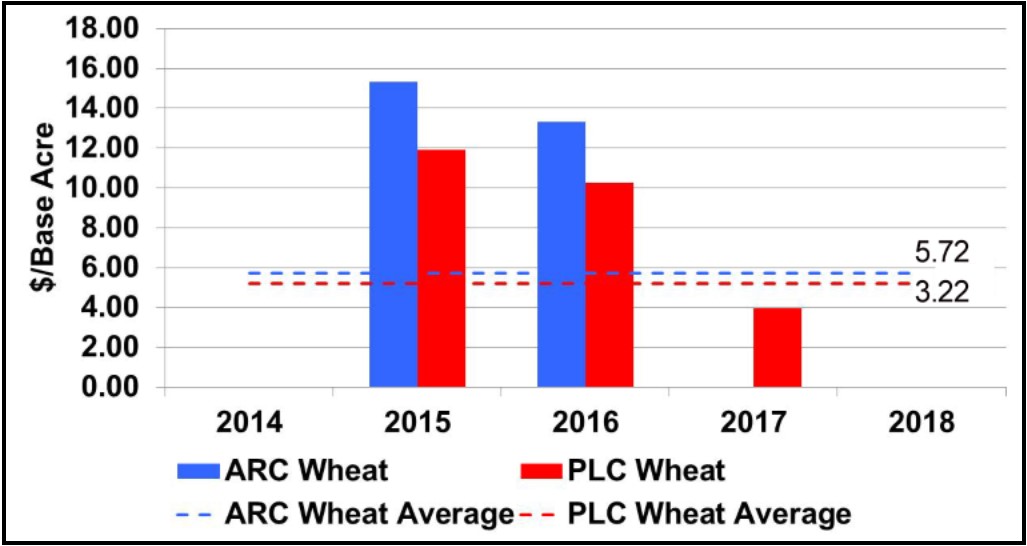
* Projected ARC and PLC payments in Figures 3-8 for 2014-2018 based on estimated yields and USDA-WAOB price projections as of January 12, 2015 and FAPRI estimates as of January 2015. Projected ARC payments shown at state level for illustration purposes only.
The graphical illustration suggests that ARC still dominates for all crops in Nebraska, but the illustration assumes perfect knowledge about prices and yields through 2018. While the FAPRI-projected prices are based on current results of one of the strongest and most complete economic models of the global agricultural sector, it is still a forecast. If changing supply and demand fundamentals change the direction of price changes through 2018, the results could change substantially as well.
Using nonirrigated corn again as an example, consider the ARC vs. PLC analysis under a bullish projection for corn to climb from $3.65 to $4.00 through 2018 as opposed to a bearish scenario for corn to fall from $3.65 to $3.00 through 2018. The comparison of ARC and PLC payments in Figures 9 and 10 show substantially different results. Figure 9 shows ARC payments dominating under the $4.00 corn scenario, similar to current FAPRI projections, while PLC becomes much more significant in later years under the $3.00 corn scenario.
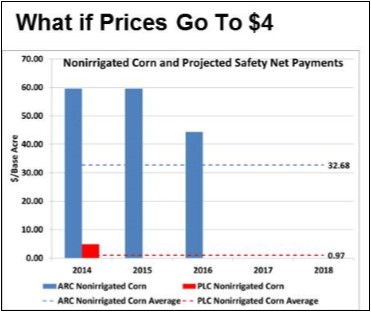
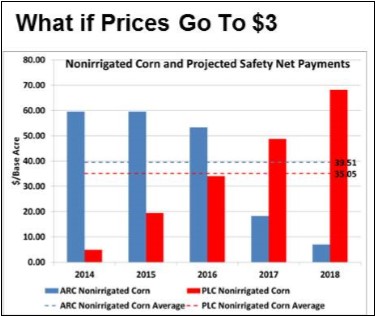
Figure 10. Nonirrigated Corn Program Payments if Prices Go To $3
* Projected ARC and PLC payments in Figures 9-10 for 2014-2018 based on estimated yields and USDA-WAOB price projections as of January 12, 2015 and FAPRI estimates as of January 2015. Projected ARC payments shown at state level for illustration purposes only.
The illustration still shows an advantage for ARC over PLC, but the difference is much smaller, making the decision much more uncertain. Furthermore, the graphs show projected payments through 2018 assuming perfect knowledge of prices and yields. If producers consider not just the direction of price changes, but also the uncertainty from year to year in both yield and price changes, the analysis can change substantially. More uncertainty creates more extreme outcomes of yields, prices, and revenues. And, since both programs pay based on the lower price or revenue outcomes, the addition of uncertainty adds to the expectation of payments and generally increases the average expected payments generally increasing the performance of PLC relative to ARC and making the decision even more uncertain. Using the available farm program decision tools allows producers to study the impact of not just alternative price projections, but also yield and price uncertainty on the performance of ARC and PLC.
Supplemental Coverage Option
As complicated as the ARC vs. plc decision may be, it is not complete unless one also considers the potential value of the Supplemental Coverage Option (SCO). SCO is a county-based supplemental crop insurance plan that can be added on top of a producers individual buy-up crop insurance coverage. The upper limit of SCO is 86%, the same as with ARC, while the lower limit of SCO is whatever crop insurance coverage level the producer chooses, from 50% to 85% protection. So the supplemental band of coverage provided by SCO could be as small as 1% (86% - 85%) or as large as 36% (86% - 50%). Like individual crop insurance coverage, SCO is designed to be actuarially fair, with total expected indemnities equal to total premiums over time. And like individual crop insurance, SCO is substantially subsidized, with the federal government paying 65% of the total premium, leaving the producers responsible for just 35% of the total premium. This compares favorably with the subsidy rate on higher levels of coverage for individual crop insurance, meaning some producers may find SCO an attractive alternative to higher levels of individual coverage. But, the benefit of SCO is only available on crops not enrolled in the ARC program. Thus, the farm program decision between ARC and PLC is really a decision between ARC and PLC plus SCO. This is why the online farm program decision tools available through links from the USDA Farm Service Agency website (fsa.usda.gov) or from UNL Extension's farm bill website (farmbill.unl.edu) show expected benefits of ARC, PLC, and SCO in their tables and charts.
Individual Buy-Up Crop Insurance
While the farm program decision tools readily provide this analysis of ARC vs. PLC plus SCO, it is not enough to stop there and make a decision. The value of SCO and thus the value of PLC plus SCO is inherently based on the gap between 86% and the individual buy-up insurance coverage level producers choose. Lower levels of individual coverage will make SCO look bigger while higher levels of individual coverage will make SCO look smaller. But, if the value of SCO is counted in the analysis, then the value of the individual buy-up coverage should also be counted to fairly analyze the entire safety net available to producers. Individual buy-up insurance coverage is available from 50% protection to 85% protection and is subsidized from 38% to 80% based on the coverage level and unit structure purchased.
Producers looking at just the expected return of crop insurance might focus on coverage levels that maximize expected net indemnities (expected indemnities minus farmer-paid premiums) for just individual coverage (under ARC) or for the combination of individual coverage and companion SCO (under PLC) and modify their ARC vs. PLC decision accordingly. But, for producers that are looking to manage downside risk on the farm, increasing the coverage level even higher could provide valuable risk protection, even if it comes at a cost (in terms of expected net indemnities). That would imply a smaller role for SCO, and thus a smaller benefit from the PLC plus SCO option than may appear at first sight.
Optimizing the Portfolio
Looking beyond the straight-forward analysis of ARC vs. PLC payments to include SCO and individual buy-up crop insurance certainly adds complexity to the analysis. But, it also provides the clearest picture of the overall farm income safety net available to producers. In fact, both of the online farm program decision tools allow you to study this full portfolio of crop revenue - ARC, PLC, SCO, and buy-up crop insurance - either in the safety net tab (the APAS tool from Illinois) or the insurance module (the AFPC tool from Texas A&M/FAPRI). With the base and yield decision deadline of February 27 and the ARC vs. PLC deadline of March 31, there is just enough time to finish this full analysis with the added benefit of helping with crop insurance decisions due about the same time (March 15 for spring planted crops in Nebraska). It is worth the time and analysis, for now and for the future.
Bradley D. Lubben
Extension Assistant Professor, Policy Specialist,
Director, North Central Extension Risk Management Education Center
Department of Agricultural Economics
University of Nebraska-Lincoln
blubben2@unl.edu