Cornhusker Economics May 4, 2016Unemployment in Ag-Dominant States During and After the Great Recession
The United States and the world saw a major economic decline at the end of 2007. A recession is defined as two or more consecutive quarters of negative economic growth. This one was so severe that it was given a name -- The Great Recession --and called the worst economic crisis since The Great Depression. In the United States more than 7.5 million jobs were lost, doubling the unemployment rate (Grusky, D. B. et al, 2011). There have been several investigations into the causes of the economic recession. The general conclusion is that there were complex and interlinked factors behind the emergence of the crisis, namely loose monetary policies, global imbalances, misperception of risk and lax financial regulation (Verick, S., & I. Islam, 2010).
Among those reasons, one which contributed to the crisis was the subprime mortgages meltdown. One of the primary causes of the subprime meltdown was the structure of securitization as applied to subprime and other non-prime residential loans, along with resecuritization of the resulting mortgage-backed securities (Eggert, K. 2008-2009). In the aftermath of the economic recession, Congress responded by passing many regulations and broad financial reforms; most notably, the Dodd-Frank Act, which increased oversight of financial institutions with goals to protect consumers and avoid another financial crisis (Merkley, J., & C. Levin, 2011).
However, the fact remains that economic cycles have always prevailed in the United States in the post-World War II era. In addition, some states are affected more by the downturn in economic growth than others. For instance, the unemployment rate, which is one of the key economic indicators used to measure the economic health of a state, was 11.5 percent in Nevada in 2009 (more than a 200 percent increase compared to 2007) while it was only 4.7 percent in Nebraska (a 56.7 percent increase compared to 2007). In a recent analysis we compared unemployment rates between states where agriculture is a dominant industry and those states with a small agricultural economy. We use data on agricultural production from the USDA-Economic Research Service (ERS) for the year 2010 and rank states based on total receipts for all agricultural commodities. We then compare the top 15 states with the lowest 15 states. Data on average annual unemployment from 2007 to 2013 from the Bureau of Labor is used to compare the 30 states.
Tables 1 and 2 show the state receipts for all agricultural commodities and annual unemployment rates for the two groups of states. A common hypothesis is that states with large agricultural economies are not hit as hard as other states during economic declines. However, Tables 1 and 2 do not show a clear pattern in the unemployment rate to support this hypothesis.
| RANKING | STATE | STATE RECEIPTS FOR ALL AG COMMODITIES (IN $1,000) | ANNUAL UNEMPLOYMENT RATES | ||||||
|---|---|---|---|---|---|---|---|---|---|
| 2007 | 2008 | 2009 | 2010 | 2011 | 2012 | 2013 | |||
| 1 | California | 38,388,218 | 5.4 | 7.5 | 11.3 | 12.1 | 11.6 | 10.2 | 8.8 |
| 2 | Iowa | 23,891,765 | 3.7 | 4.3 | 6.4 | 6 | 5.5 | 5 | 4.7 |
| 3 | Texas | 20,343,148 | 4.3 | 4.9 | 7.6 | 8.1 | 7.7 | 6.6 | 6 |
| 4 | Nebraska | 17,018,675 | 3 | 3.4 | 4.7 | 4.6 | 4.3 | 3.9 | 3.7 |
| 5 | Illinois | 15,907,425 | 5 | 6.5 | 10.3 | 10.3 | 9.6 | 9 | 8.9 |
| 6 | Minnesota | 15,526,156 | 4.6 | 5.5 | 7.8 | 7.3 | 6.4 | 5.5 | 4.8 |
| 7 | Kansas | 14,761,486 | 4.3 | 4.7 | 6.9 | 7 | 6.4 | 5.7 | 5.2 |
| 8 | North Carolina | 9,777,231 | 4.8 | 6.3 | 10.6 | 10.7 | 10.1 | 9.1 | 7.8 |
| 9 | Indiana | 9,748,067 | 4.6 | 6.1 | 10.4 | 10.3 | 9 | 8.3 | 7.5 |
| 10 | Wisconsin | 9,020,955 | 4.9 | 5 | 8.7 | 8.6 | 7.7 | 7 | 6.6 |
| 11 | Missouri | 8,517,439 | 5.2 | 6.3 | 9.3 | 9.5 | 8.3 | 6.9 | 6.5 |
| 12 | Ohio | 7,984,435 | 5.6 | 6.6 | 10.4 | 10.2 | 8.8 | 7.4 | 7.3 |
| 13 | Arkansas | 7,965,816 | 5.3 | 5.5 | 7.9 | 8.2 | 8.2 | 7.5 | 7.2 |
| 14 | Florida | 7,741,348 | 4.1 | 6.5 | 10.5 | 10.9 | 9.8 | 8.3 | 7 |
| 15 | Washington | 7,655,264 | 4.7 | 5.5 | 9.2 | 9.9 | 9.1 | 8 | 6.9 |
| U.S. | 321,195,035 | 4.6 | 5.8 | 9.3 | 9.6 | 8.9 | 8.1 | 7.4 |
| RANKING | STATE | STATE RECEIPTS FOR ALL AG COMMODITIES (IN $1,000) | ANNUAL UNEMPLOYMENT RATES | ||||||
|---|---|---|---|---|---|---|---|---|---|
| 2007 | 2008 | 2009 | 2010 | 2011 | 2012 | 2013 | |||
| 36 | Maryland | 1,865,558 | 3.5 | 4.4 | 7.1 | 7.6 | 7.1 | 6.9 | 6.5 |
| 37 | Utah | 1,360,021 | 2.6 | 3.6 | 7.5 | 7.9 | 6.7 | 5.4 | 4.4 |
| 38 | Wyoming | 1,178,262 | 2.9 | 3.1 | 6.3 | 6.5 | 5.8 | 5.3 | 4.7 |
| 39 | Delaware | 1,087,278 | 3.5 | 5 | 8.3 | 8.4 | 7.5 | 7.2 | 6.7 |
| 40 | New Jersey | 943,389 | 4.3 | 5.4 | 9.1 | 9.5 | 9.3 | 9.2 | 8 |
| 41 | Maine | 701,784 | 4.7 | 5.5 | 8.1 | 8.1 | 7.9 | 7.5 | 6.6 |
| 42 | Vermont | 687,979 | 4 | 4.7 | 6.6 | 6.1 | 5.5 | 4.9 | 4.4 |
| 43 | Hawaii | 686,902 | 2.8 | 4.3 | 7.1 | 6.9 | 6.8 | 6 | 4.8 |
| 44 | Nevada | 576,638 | 4.5 | 6.7 | 11.5 | 13.5 | 13 | 11.1 | 9.4 |
| 45 | Connecticut | 553,886 | 4.5 | 5.7 | 8.1 | 9.1 | 8.8 | 8.3 | 7.6 |
| 46 | West Virginia | 545,369 | 4.6 | 4.5 | 7.8 | 8.6 | 8 | 7.4 | 6.7 |
| 47 | Massachusetts | 492,062 | 4.7 | 5.6 | 8.3 | 8.3 | 7.2 | 6.7 | 6.6 |
| 48 | New Hampshire | 208,701 | 3.5 | 3.9 | 6.3 | 5.8 | 5.4 | 5.5 | 5.1 |
| 49 | Rhode Island | 78,390 | 5.2 | 7.8 | 11.1 | 11.2 | 11.1 | 10.4 | 9.2 |
| 50 | Alaska | 31,341 | 6.4 | 6.7 | 7.7 | 7.9 | 7.6 | 7.1 | 6.9 |
| U.S. | 321,195,035 | 4.6 | 5.8 | 9.3 | 9.6 | 8.9 | 8.1 | 7.4 |
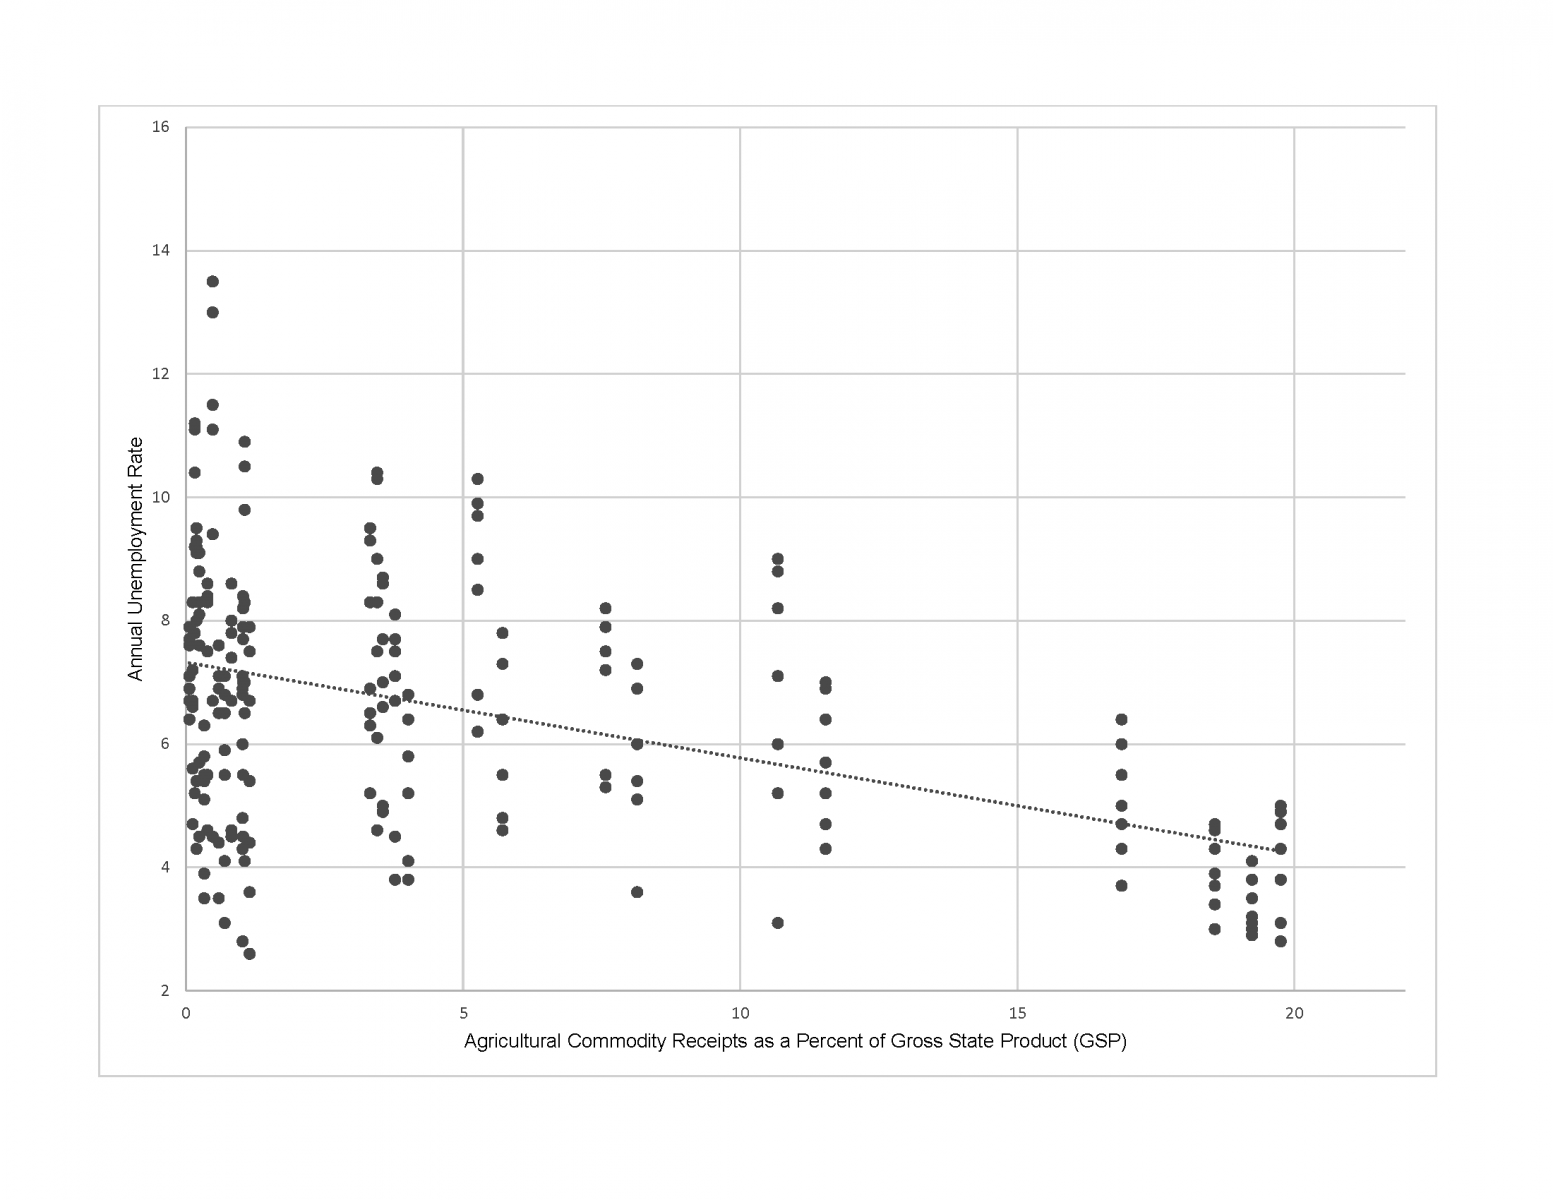
We rank the states again based on the contribution of agriculture to the Gross State Product (GSP). We do this because if the agricultural industry helps protect a state from increased unemployment, the relative size of the industry is a better indicator than the absolute measure. As before, annual average unemployment rates were listed for the states for years 2007-2013. Table 3 shows the revised list.
Figure 1 shows a plot of the annual unemployment rate and the agricultural state GSP (as a percent) for all states. It shows a negative correlation between the two variables.
Conclusions and policy implications
There are two important conclusions from this study. First, the absolute measure of agricultural production value does not determine the ability of a state to absorb economic downturns. However, the relative measure (agricultural production as a percent of GSP), suggests that there is a negative relationship between the relative measure and unemployment rate. This relationship holds in both normal and economic-decline years. Furthermore, this relationship is even stronger when the agricultural share of GSP is above 11 percent. So, marginal states might be better off investing more in agriculture production in order to absorb economic downturns.
University of Central Missouri
Sankalp Sharma
Ph.D. Candidate
Department of Agricultural Economics
University of Nebraska-Lincoln
References
References: Eggert, K. (2008-2009). Great Collapse: How Securitization Caused the Subprime Meltdown, The. Connecticut Law Review 41(4), 1257-1312.
ERS farm cash receipts by commodity and State are computed from USDA’s National Agricultural Statistics Service (NASS) production data and unit prices of farm products in each State: http://www.ers.usda.gov/Data/FarmIncome/FinfidmuXls.htm.
Grusky, D. B., Western, B., & Wimer, C. C. (Eds.). (2011). The great recession. Russell Sage Foundation.
Merkley, J., & Levin, C. (2011). Dodd-Frank Act Restrictions on Proprietary Trading and Conflicts of Interest: New Tools to Address Evolving Threats, The. Harv. J. on Legis., 48, 515.
U.S. agricultural export values by State are obtained from the USDA Foreign Agricultural Service’s Global Agricultural Trade System (GATS): http://www.fas.usda.gov/gats/default.aspx Farm production data by State are published by NASS, Quick Stats 2.0: http://www.nass.usda.gov/Quick_Stats/
Verick, S., & I. Islam. (2010). The great recession of 2008-2009: causes, consequences and policy responses
Topic: