Cornhusker Economics August 22, 2018Economics of Experimental Design: Finding the Optimal Design of a Whole Field Randomized Experiment
Background
An April 2017 Cornhusker Economics article Getting to Know Your Yield Response Better through Whole-field Randomized Experiments presented a case study detailing a whole-field randomized agronomic experiment (nitrogen and seed rate). The study was conducted in Kentucky and funded through the USDA-NIFA Data Intensive Farm Management (DIFM) project. The project has so far resulted in more than 50 experiments across several states, including Illinois, Nebraska, Kansas, and Washington. The overarching goal of the project is to provide agricultural producers with the best input rate, variable or uniform, which maximizes their farm profits. This involves statistically estimating the crop response function and then the mathematical optimization to identify the best input rate based on the estimated response function.
In the three years since the outset of the project, how the whole-field randomized agronomic experiments should be designed has generated lively discussions among the project researchers. Aolin Gong, a second-year Ph.D. student in the Department of Agricultural and Consumer Economics at the University of Illinois Urbana-Champaign, (with some help from David Bullock and Taro Mieno) undertook a study to address some of the issues the DIFM group has been discussing. This article will discuss the current findings. The specific questions investigated were (1) how long each plot should be and (2) how many levels of nitrogen to be examined should be tested in the context of corn production in Kansas.
Research Questions
Question (1): How long should each plot be?
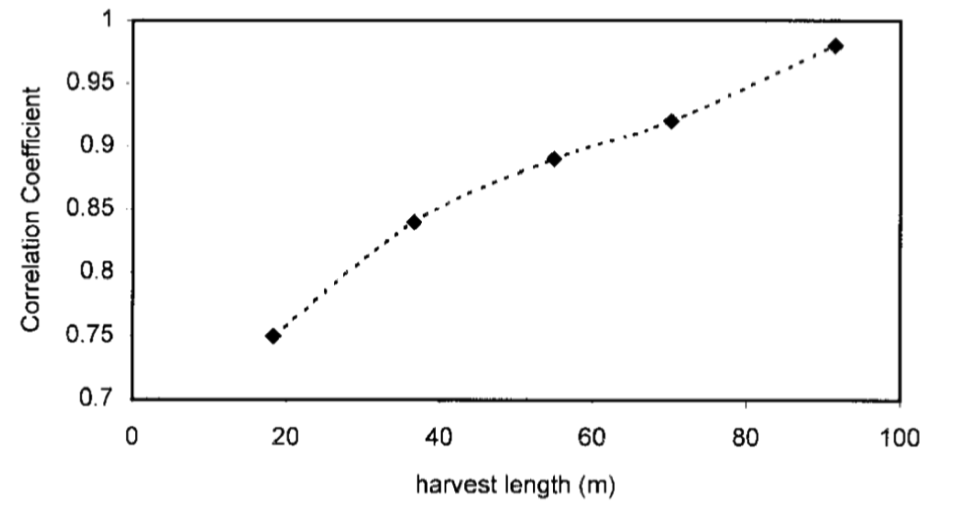
The DIFM project uses yield monitors to measure crop yield. Weigh wagons would be an ideal choice if only seeking the accuracy of yield data collected. However, given the number and scale of experiments, it is simply infeasible because of the labor required. Crop yield measured by yield monitors necessarily involves errors. The longer the plot, the more accurate their measures become, meaning that the average of yield data points by a yield monitor becomes closer to the actual average yield of that plot (Al-Mahasneh and Colvin. 2000). In Figure 1, the y-axis is the correlation coefficient of actual yield (measured by a weigh wagon) and yield measure from a yield monitor, and the x-axis is the harvest length for which the correlation was calculated.
As indicated in Figure 1, the correlation coefficient goes up as harvest length increases. The trade-off is the number of replications for each level of the nitrogen rates and data accuracy. As plot lengths are shortened there are more plots (more replications), but the yield data obtained at each plot is less accurate. The question is what plot length strikes the best balance of those competing effects to make farmers a higher profit via the statistically identified optimal nitrogen level based on the collected data.
Figure 1
Question (2): How many levels of nitrogen should be tried?
When statistically estimating crop yield response, it is important to capture the curvature of the response function accurately to be able to reliably recommend the best nitrogen rate based on the estimated response. For example, consider an extreme case (which nobody does in practice for an obvious reason) of only two levels of nitrogen rates tested. Then you cannot capture any non-linearity of the response function. Once the number is increased to three, there is a better chance of capturing the non-linearity of the response function. In general, the greater number of rates examined, the better to capture the curvature of the response function. However, a greater number of levels of nitrogen rates means the number of replications at each level becomes smaller. Again, the question is what number of nitrogen levels strikes the best balance of those competing effects to make farmers a higher profit via the statistically identified optimal nitrogen level based on the collected data.
Method
In order to answer these questions, a statistical simulation technique called, Monte Carlo (MC) simulations as employed. In essence, it allows researchers to simulate crop yield, hypothetically collect data using yield monitors (with errors introduced to actual simulated yields), conduct regression analysis on the hypothetical collected data and find the optimal nitrogen rate that maximized the profit. This process was repeated for various combinations of plot lengths and numbers of nitrogen levels. Then the combinations were compared to determine the best in terms of profit. While hypothetical analysis like this is not real, it still provides us with good insights into the economics of experimental design.
The hypothetical field was 70 acres in size. Figure 2 shows an example of the hypothetical whole-field randomized nitrogen experiments with four treatment levels.
Figure 2

Results
The results of the MC simulations are presented in Table 1 and color-coded by plot length.
Table 1

Conclusion
In summary, it seems that the design (four treatment levels with each plot as long as 330 feet), which is close to what has been implemented for DIFM experiments, performs the best. The caveat here is that Aolin Gong conducted the analysis for one field in Kansas. So, clearly, the findings cannot be generalized to other production areas where production conditions are markedly different. An obvious extension would be to do the same analysis for other fields with various production environments. Despite this limitation, the study is a good start towards coming up with a better experimental design for whole-field agronomic randomized experiments.
Taro Mieno
Assistant Professor
Department of Agricultural Economics
University of Nebraska-Lincoln
tmieno2@unl.edu
402-472-4134
David Bullock
Professor
Department of Agricultural and Consumer Economics
University of Illinois at Urbana-Champaign
dsbulloc@illinois.edu
Aolin Gong
Ph.D. Student
Department of Agricultural and Consumer Economics
University of Illinois at Urbana-Champaign
aoling2@illinois.edu